Django Chart.js and Hightchart ajax views


Project description
Django Chartjs lets you manage charts in your Django application.


This is compatible with Chart.js and Highcharts JS libraries.
Using a set of predefined Class Based Views you are able to get started after writing just your SQL query.
Authors: Rémy Hubscher and contributors
Licence: BSD
Compatibility: Django 1.10, 2.2 and 3.0, python3.6 up to python3.8
Project URL: https://github.com/peopledoc/django-chartjs
Getting Started
Install django-chartjs:
pip install django-chartjs
Add it to your INSTALLED_APPS settings:
INSTALLED_APPS = (
    '...',
    'chartjs',
)
Using it
A simple Line Chart example.
1. Create the HTML file
{% load static %}
<html>
<head>
<title>django-chartjs line chart demo</title>
<!--[if lte IE 8]>
<script src="{% static 'js/excanvas.js' %}"></script>
<![endif]-->
</head>
<body>
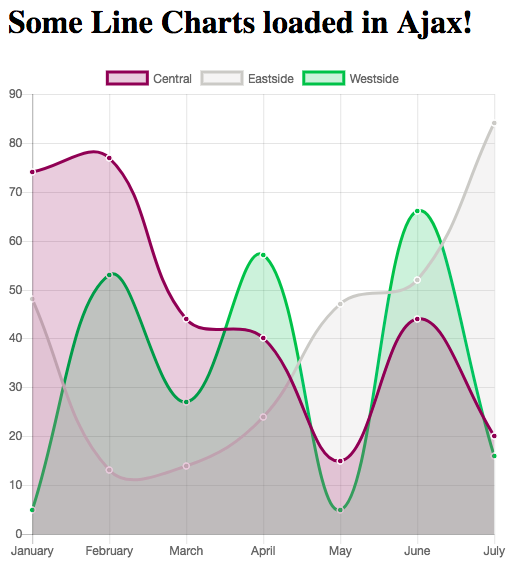
<h1>Some Line Charts loaded in Ajax!</h1>
<canvas id="myChart" width="500" height="400"></canvas>
<script type="text/javascript" src="http://code.jquery.com/jquery-1.10.0.min.js"></script>
<script type="text/javascript" src="{% static 'js/Chart.min.js' %}"></script>
<script type="text/javascript">
$.get('{% url "line_chart_json" %}', function(data) {
var ctx = $("#myChart").get(0).getContext("2d");
new Chart(ctx, {
type: 'line', data: data
});
});
</script>
</body>
</html>2. Create the view with labels and data definition
from django.views.generic import TemplateView
from chartjs.views.lines import BaseLineChartView


class LineChartJSONView(BaseLineChartView):
    def get_labels(self):
        """Return 7 labels for the x-axis."""
        return ["January", "February", "March", "April", "May", "June", "July"]

    def get_providers(self):
        """Return names of datasets."""
        return ["Central", "Eastside", "Westside"]

    def get_data(self):
        """Return 3 datasets to plot."""

        return [[75, 44, 92, 11, 44, 95, 35],
                [41, 92, 18, 3, 73, 87, 92],
                [87, 21, 94, 3, 90, 13, 65]]


line_chart = TemplateView.as_view(template_name='line_chart.html')
line_chart_json = LineChartJSONView.as_view()
3. Update urls.py with the new urls for TemplateView and AJAX call ‘line_chart_json’ as in chart.html
from .views import line_chart, line_chart_json

urlpatterns = [
  '...',
  path('chart', line_chart, name='line_chart'),
  path('chartJSON', line_chart_json, name='line_chart_json'),
]
4. Get a Chart.js Line Chart
It is that simple!
For other examples including a HighCharts line chart, don’t hesitate to look at the demo project.
Also, feel free to contribute your demo!
Release history Release notifications | RSS feed


Download files
Download the file for your platform. If you're not sure which to choose, learn more about installing packages.
Source Distribution
Built Distribution
Hashes for django_chartjs-2.3.0-py3-none-any.whl
| Algorithm | Hash digest | |
|---|---|---|
| SHA256 | 3cc1660ff1403c021b3ede163062120e36fde194e97e1a84a7eb1a8f09223183 |
|
| MD5 | 05402478292b66fb02ed8de04bc22c4c |
|
| BLAKE2b-256 | a1a9a9684ca39c70b84edbf15c7e506fabe46c639806b42d23e6356f2c441af0 |


