A small library for creating pretty heatmaps of daily data.

Project description

July
A small library for creating pretty heatmaps of daily data.
Features
- Get rid of the eternal matplotlib tweaking every time you want to plot data in proper calendar format.
- Generate GitHub activity overview-like heatmaps of your daily data.
- Automatic handling of missing dates in input date range.
Julydoes not rely only pandas (though it accepts it). Only numpy arrays and native Python data structures are used internally.- Accepted date formats:
datetime.datetime,datetime.date,str,pd.DatetimeIndex
Install
$ pip install july
Usage
import numpy as np
import matplotlib.pyplot as plt
import july
from july.utils import date_range

dates = date_range("2020-01-01", "2020-12-31")
data = np.random.randint(0, 14, len(dates))
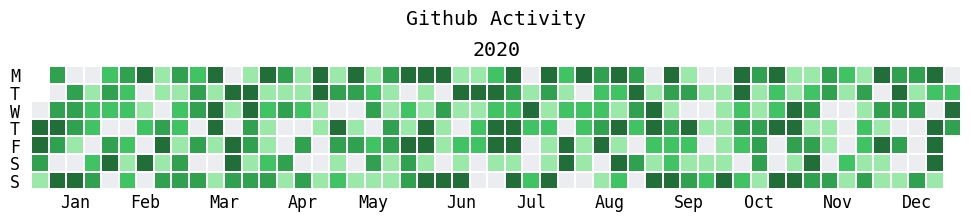
# GitHub Activity like plot (for someone with consistently random work patterns).
july.heatmap(dates, data, title='Github Activity', cmap="github")
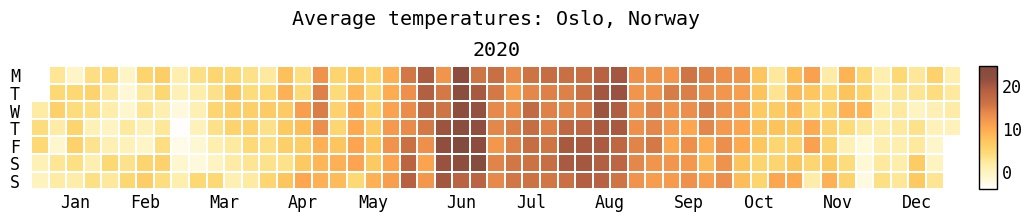
# Here, 'osl_df' is a pandas df.
july.heatmap(osl_df.date, osl_df.temp, cmap="golden", colorbar=True, title="Average temperatures: Oslo , Norway")
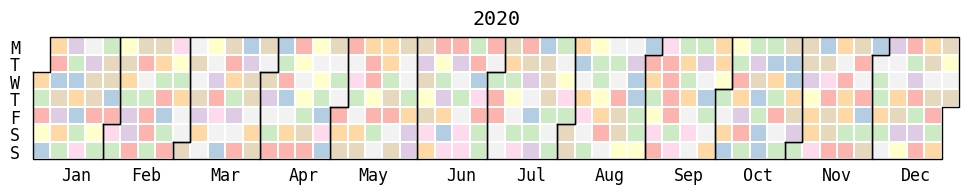
# More exhaustive example using useless, but pretty colours.
july.heatmap(dates=dates,
             data=data,
             cmap='Pastel1',
             month_grid=True,
             horizontal=True,
             value_label=False,
             date_label=False,
             weekday_label=True,
             month_label=True,
             year_label=True,
             colorbar=False,
             fontfamily="monospace",
             fontsize=12,
             title=None,
             titlesize='large',
             dpi=100)
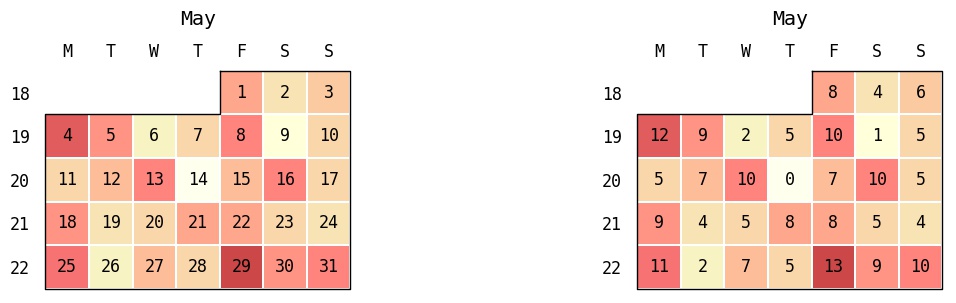
# Month plot with dates.
july.month_plot(dates, data, month=5, date_label=True, ax=axes[0])
# Month plot with values.
july.month_plot(dates, data, month=5, value_label=True, ax=axes[1])
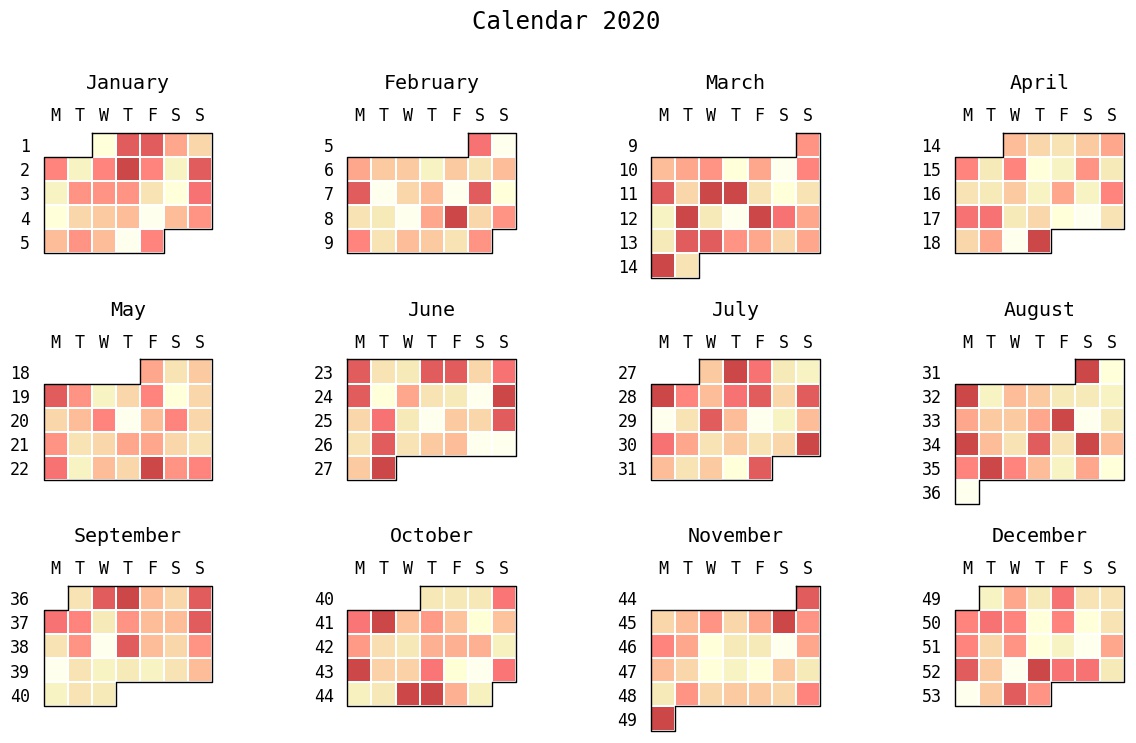
# Calendar plot.
july.calendar_plot(dates, data)
Why "July"?
Main reason: All the obvious names like calplot, calmap, and calendarplot were all already taken by similar packages. This had me looking for a new name that wouldn't get easily mixed up with the other packages.
The reasoning was roughly as follows:
Heatmap+month→Hot month→July:sparkles:
Also, as a summer loving person stuck in the Northern hemisphere, July is my favourite month by a light year.
Release notes
v0.1.0: Working build but with minimal documentation.v0.1.1: Fix relative image link in readme.v0.1.2: Remove unnecessary argument from rcmod to be compatible with matplotlib versions earlier than v3.4.x.v0.1.3: Fix week number labelling bug inmonth_plot()andcalendar_plot()
TODO:
- Fix slight misalignment of plot and cbar when
date_gridandcolorbarare used in conjunction. - Document everything...
- Add type hints.
- Add automatic date handling for strings of more types than just
YYYY-MM-DD.


Download files
Download the file for your platform. If you're not sure which to choose, learn more about installing packages.
Source Distribution
july-0.1.3.tar.gz
(13.5 kB
view hashes)
Built Distribution
july-0.1.3-py3-none-any.whl
(13.0 kB
view hashes)


