A module for monitoring memory usage of a python program


Project description

Memory Profiler
Note: This package is no longer actively maintained. I won’t be actively responding to issues. If you’d like to volunteer to maintain it, please drop me a line at f@bianp.net
This is a python module for monitoring memory consumption of a process as well as line-by-line analysis of memory consumption for python programs. It is a pure python module which depends on the psutil module.
Installation
Install via pip:
$ pip install -U memory_profiler
The package is also available on conda-forge.
To install from source, download the package, extract and type:
$ pip install .
Quick Start
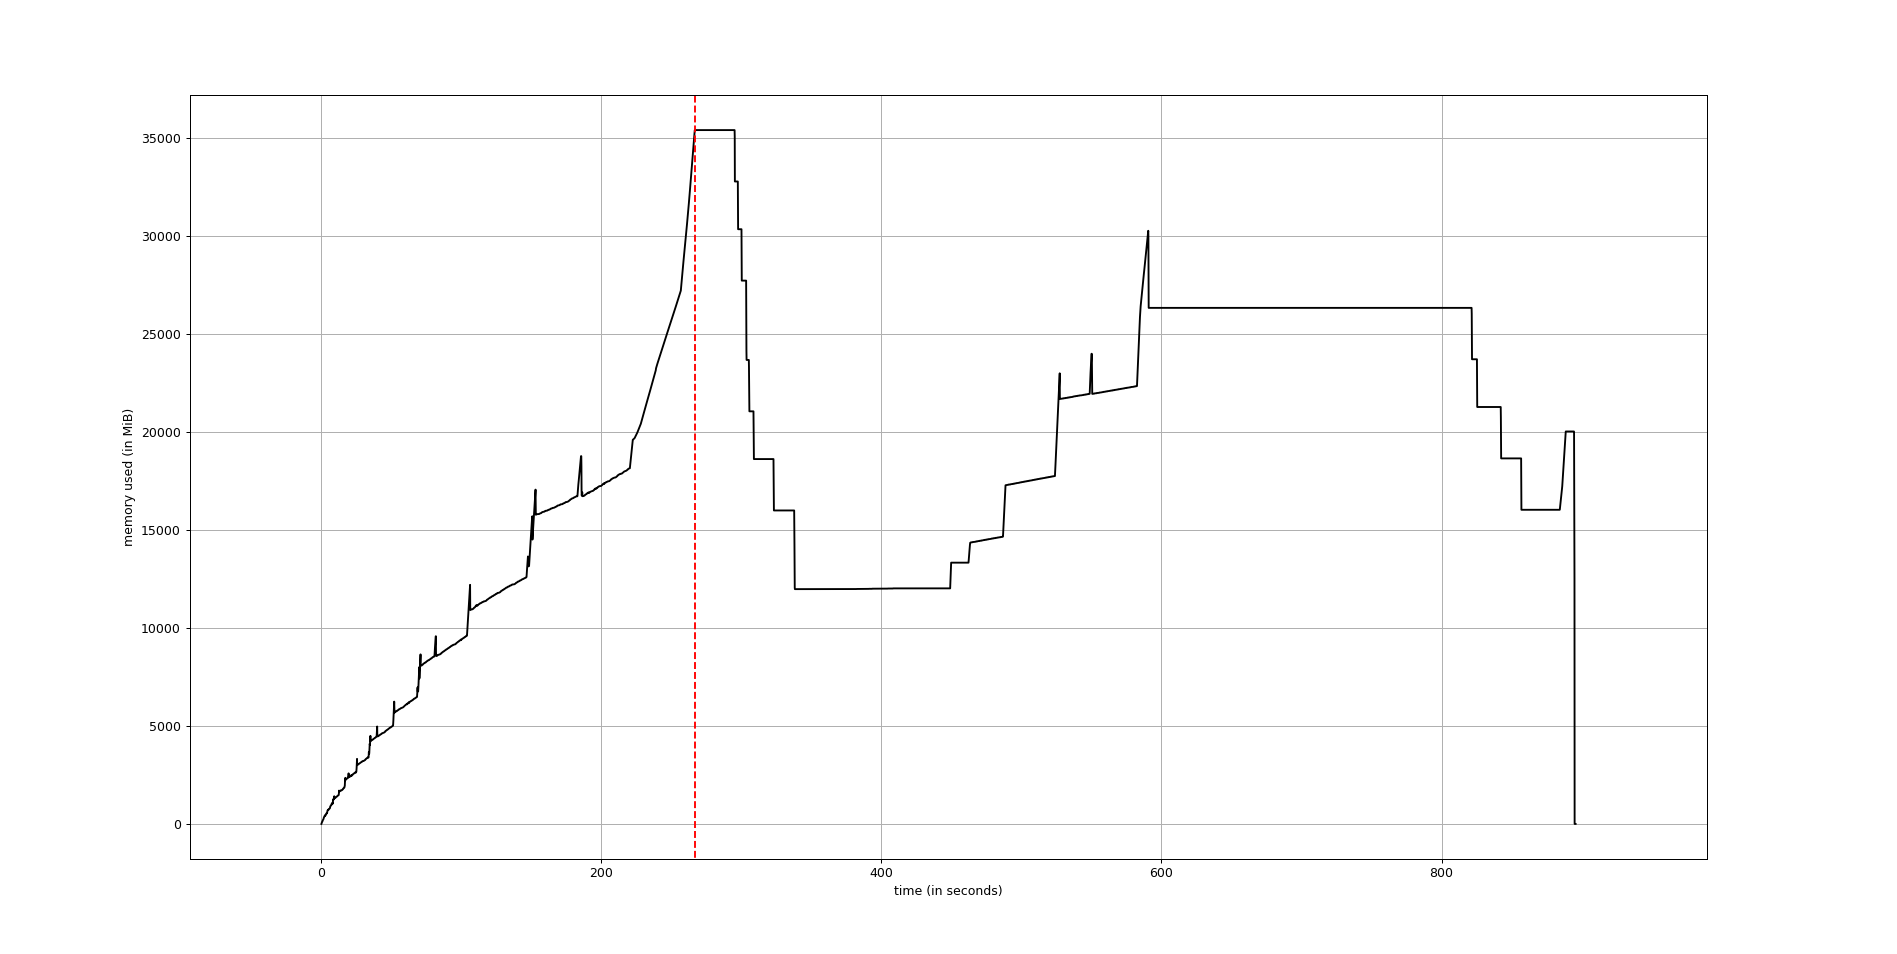
Use mprof to generate a full memory usage report of your executable and to plot it.
mprof run executable
mprof plot
The plot would be something like this:
Usage
line-by-line memory usage
The line-by-line memory usage mode is used much in the same way of the line_profiler: first decorate the function you would like to profile with @profile and then run the script with a special script (in this case with specific arguments to the Python interpreter).
In the following example, we create a simple function my_func that allocates lists a, b and then deletes b:
@profile
def my_func():
    a = [1] * (10 ** 6)
    b = [2] * (2 * 10 ** 7)
    del b
    return a

if __name__ == '__main__':
    my_func()
Execute the code passing the option -m memory_profiler to the python interpreter to load the memory_profiler module and print to stdout the line-by-line analysis. If the file name was example.py, this would result in:
$ python -m memory_profiler example.py
Output will follow:
Line #    Mem usage    Increment  Occurrences   Line Contents
============================================================
     3   38.816 MiB   38.816 MiB           1   @profile
     4                                         def my_func():
     5   46.492 MiB    7.676 MiB           1       a = [1] * (10 ** 6)
     6  199.117 MiB  152.625 MiB           1       b = [2] * (2 * 10 ** 7)
     7   46.629 MiB -152.488 MiB           1       del b
     8   46.629 MiB    0.000 MiB           1       return a
The first column represents the line number of the code that has been profiled, the second column (Mem usage) the memory usage of the Python interpreter after that line has been executed. The third column (Increment) represents the difference in memory of the current line with respect to the last one. The last column (Line Contents) prints the code that has been profiled.
Decorator
A function decorator is also available. Use as follows:
from memory_profiler import profile

@profile
def my_func():
    a = [1] * (10 ** 6)
    b = [2] * (2 * 10 ** 7)
    del b
    return a
In this case the script can be run without specifying -m memory_profiler in the command line.
In function decorator, you can specify the precision as an argument to the decorator function. Use as follows:
from memory_profiler import profile

@profile(precision=4)
def my_func():
    a = [1] * (10 ** 6)
    b = [2] * (2 * 10 ** 7)
    del b
    return a
If a python script with decorator @profile is called using -m memory_profiler in the command line, the precision parameter is ignored.
Time-based memory usage
Sometimes it is useful to have full memory usage reports as a function of time (not line-by-line) of external processes (be it Python scripts or not). In this case the executable mprof might be useful. Use it like:
mprof run <executable>
mprof plot
The first line run the executable and record memory usage along time, in a file written in the current directory. Once it’s done, a graph plot can be obtained using the second line. The recorded file contains a timestamps, that allows for several profiles to be kept at the same time.
Help on each mprof subcommand can be obtained with the -h flag, e.g. mprof run -h.
In the case of a Python script, using the previous command does not give you any information on which function is executed at a given time. Depending on the case, it can be difficult to identify the part of the code that is causing the highest memory usage.
Adding the profile decorator to a function(ensure no from memory_profiler import profile statement) and running the Python script with
mprof run –python python <script>
will record timestamps when entering/leaving the profiled function. Running
mprof plot
afterward will plot the result, making plots (using matplotlib) similar to these:

or, with mprof plot --flame (the function and timestamp names will appear on hover):

A discussion of these capabilities can be found here.
The available commands for mprof are:
mprof run: running an executable, recording memory usage
mprof plot: plotting one the recorded memory usage (by default, the last one)
mprof list: listing all recorded memory usage files in a user-friendly way.
mprof clean: removing all recorded memory usage files.
mprof rm: removing specific recorded memory usage files
Tracking forked child processes
In a multiprocessing context the main process will spawn child processes whose system resources are allocated separately from the parent process. This can lead to an inaccurate report of memory usage since by default only the parent process is being tracked. The mprof utility provides two mechanisms to track the usage of child processes: sum the memory of all children to the parent’s usage and track each child individual.
To create a report that combines memory usage of all the children and the parent, use the include-children flag in either the profile decorator or as a command line argument to mprof:
mprof run --include-children <script>
The second method tracks each child independently of the main process, serializing child rows by index to the output stream. Use the multiprocess flag and plot as follows:
mprof run --multiprocess <script>
mprof plot
This will create a plot using matplotlib similar to this:
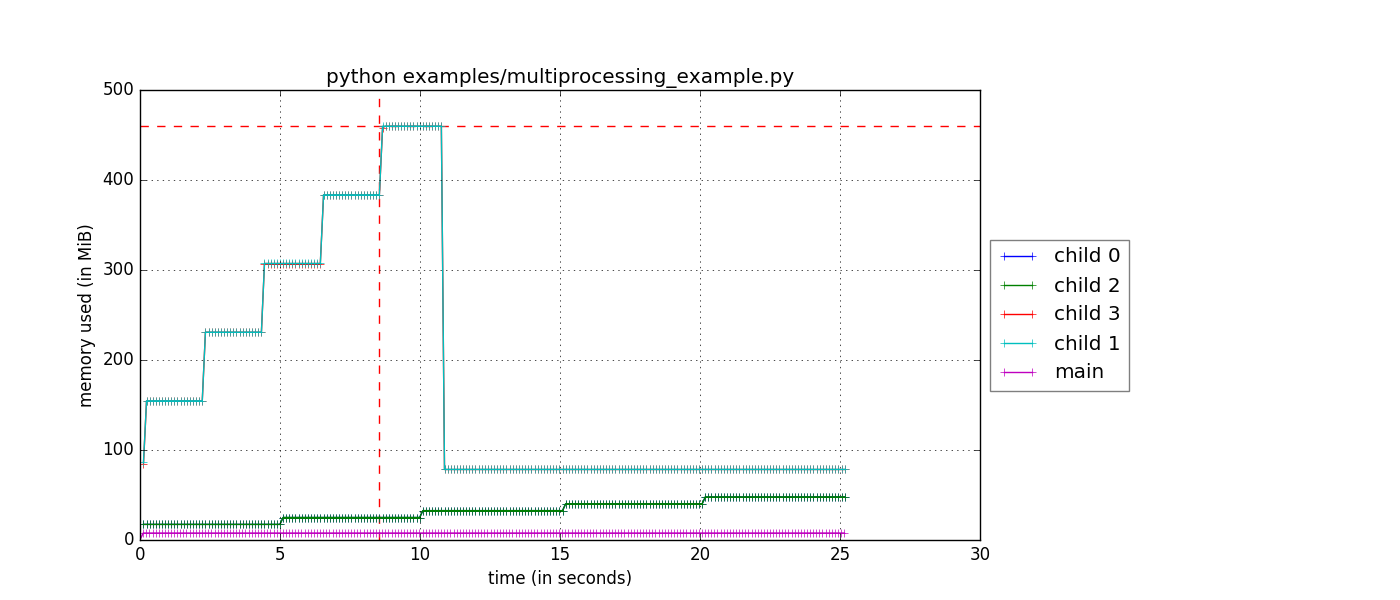
You can combine both the include-children and multiprocess flags to show the total memory of the program as well as each child individually. If using the API directly, note that the return from memory_usage will include the child memory in a nested list along with the main process memory.
Plot settings
By default, the command line call is set as the graph title. If you wish to customize it, you can use the -t option to manually set the figure title.
mprof plot -t ‘Recorded memory usage’
You can also hide the function timestamps using the n flag, such as
mprof plot -n
Trend lines and its numeric slope can be plotted using the s flag, such as
mprof plot -s

The intended usage of the -s switch is to check the labels’ numerical slope over a significant time period for :
>0 it might mean a memory leak.
~0 if 0 or near 0, the memory usage may be considered stable.
<0 to be interpreted depending on the expected process memory usage patterns, also might mean that the sampling period is too small.
The trend lines are for ilustrative purposes and are plotted as (very) small dashed lines.
Setting debugger breakpoints
It is possible to set breakpoints depending on the amount of memory used. That is, you can specify a threshold and as soon as the program uses more memory than what is specified in the threshold it will stop execution and run into the pdb debugger. To use it, you will have to decorate the function as done in the previous section with @profile and then run your script with the option -m memory_profiler --pdb-mmem=X, where X is a number representing the memory threshold in MB. For example:
$ python -m memory_profiler --pdb-mmem=100 my_script.py
will run my_script.py and step into the pdb debugger as soon as the code uses more than 100 MB in the decorated function.
API
memory_profiler exposes a number of functions to be used in third-party code.
memory_usage(proc=-1, interval=.1, timeout=None) returns the memory usage over a time interval. The first argument, proc represents what should be monitored. This can either be the PID of a process (not necessarily a Python program), a string containing some python code to be evaluated or a tuple (f, args, kw) containing a function and its arguments to be evaluated as f(*args, **kw). For example,
>>> from memory_profiler import memory_usage
>>> mem_usage = memory_usage(-1, interval=.2, timeout=1)
>>> print(mem_usage)
    [7.296875, 7.296875, 7.296875, 7.296875, 7.296875]
Here I’ve told memory_profiler to get the memory consumption of the current process over a period of 1 second with a time interval of 0.2 seconds. As PID I’ve given it -1, which is a special number (PIDs are usually positive) that means current process, that is, I’m getting the memory usage of the current Python interpreter. Thus I’m getting around 7MB of memory usage from a plain python interpreter. If I try the same thing on IPython (console) I get 29MB, and if I try the same thing on the IPython notebook it scales up to 44MB.
If you’d like to get the memory consumption of a Python function, then you should specify the function and its arguments in the tuple (f, args, kw). For example:
>>> # define a simple function
>>> def f(a, n=100):
    ...     import time
    ...     time.sleep(2)
    ...     b = [a] * n
    ...     time.sleep(1)
    ...     return b
    ...
>>> from memory_profiler import memory_usage
>>> memory_usage((f, (1,), {'n' : int(1e6)}))
This will execute the code f(1, n=int(1e6)) and return the memory consumption during this execution.
REPORTING
The output can be redirected to a log file by passing IO stream as parameter to the decorator like @profile(stream=fp)
>>> fp=open('memory_profiler.log','w+')
>>> @profile(stream=fp)
>>> def my_func():
    ...     a = [1] * (10 ** 6)
    ...     b = [2] * (2 * 10 ** 7)
    ...     del b
    ...     return a
For details refer: examples/reporting_file.py
Reporting via logger Module:
Sometime it would be very convenient to use logger module specially when we need to use RotatingFileHandler.
The output can be redirected to logger module by simply making use of LogFile of memory profiler module.
>>> from memory_profiler import LogFile
>>> import sys
>>> sys.stdout = LogFile('memory_profile_log')
Customized reporting:
Sending everything to the log file while running the memory_profiler could be cumbersome and one can choose only entries with increments by passing True to reportIncrementFlag, where reportIncrementFlag is a parameter to LogFile class of memory profiler module.
>>> from memory_profiler import LogFile
>>> import sys
>>> sys.stdout = LogFile('memory_profile_log', reportIncrementFlag=False)
For details refer: examples/reporting_logger.py
IPython integration
After installing the module, if you use IPython, you can use the %mprun, %%mprun, %memit and %%memit magics.
For IPython 0.11+, you can use the module directly as an extension, with %load_ext memory_profiler
To activate it whenever you start IPython, edit the configuration file for your IPython profile, ~/.ipython/profile_default/ipython_config.py, to register the extension like this (If you already have other extensions, just add this one to the list):
c.InteractiveShellApp.extensions = [
    'memory_profiler',
]
(If the config file doesn’t already exist, run ipython profile create in a terminal.)
It then can be used directly from IPython to obtain a line-by-line report using the %mprun or %%mprun magic command. In this case, you can skip the @profile decorator and instead use the -f parameter, like this. Note however that function my_func must be defined in a file (cannot have been defined interactively in the Python interpreter):
In [1]: from example import my_func, my_func_2

In [2]: %mprun -f my_func my_func()
or in cell mode:
In [3]: %%mprun -f my_func -f my_func_2
   ...: my_func()
   ...: my_func_2()
Another useful magic that we define is %memit, which is analogous to %timeit. It can be used as follows:
In [1]: %memit range(10000)
peak memory: 21.42 MiB, increment: 0.41 MiB

In [2]: %memit range(1000000)
peak memory: 52.10 MiB, increment: 31.08 MiB
or in cell mode (with setup code):
In [3]: %%memit l=range(1000000)
   ...: len(l)
   ...:
peak memory: 52.14 MiB, increment: 0.08 MiB
For more details, see the docstrings of the magics.
For IPython 0.10, you can install it by editing the IPython configuration file ~/.ipython/ipy_user_conf.py to add the following lines:
# These two lines are standard and probably already there.
import IPython.ipapi
ip = IPython.ipapi.get()

# These two are the important ones.
import memory_profiler
memory_profiler.load_ipython_extension(ip)
Memory tracking backends
memory_profiler supports different memory tracking backends including: ‘psutil’, ‘psutil_pss’, ‘psutil_uss’, ‘posix’, ‘tracemalloc’. If no specific backend is specified the default is to use “psutil” which measures RSS aka “Resident Set Size”. In some cases (particularly when tracking child processes) RSS may overestimate memory usage (see example/example_psutil_memory_full_info.py for an example). For more information on “psutil_pss” (measuring PSS) and “psutil_uss” please refer to: https://psutil.readthedocs.io/en/latest/index.html?highlight=memory_info#psutil.Process.memory_full_info
Currently, the backend can be set via the CLI
$ python -m memory_profiler –backend psutil my_script.py
and is exposed by the API
>>> from memory_profiler import memory_usage
>>> mem_usage = memory_usage(-1, interval=.2, timeout=1, backend="psutil")
Frequently Asked Questions
Q: How accurate are the results ?
A: This module gets the memory consumption by querying the operating system kernel about the amount of memory the current process has allocated, which might be slightly different from the amount of memory that is actually used by the Python interpreter. Also, because of how the garbage collector works in Python the result might be different between platforms and even between runs.
Q: Does it work under windows ?
A: Yes, thanks to the psutil module.
Support, bugs & wish list
For support, please ask your question on stack overflow and add the *memory-profiling* tag. Send issues, proposals, etc. to github’s issue tracker .
If you’ve got questions regarding development, you can email me directly at f@bianp.net

Development
Latest sources are available from github:
Projects using memory_profiler
PySpeedIT (uses a reduced version of memory_profiler)
pydio-sync (uses custom wrapper on top of memory_profiler)
License
BSD License, see file COPYING for full text.
Release history Release notifications | RSS feed


Download files
Download the file for your platform. If you're not sure which to choose, learn more about installing packages.
Source Distribution
Built Distribution
Hashes for memory_profiler-0.61.0-py3-none-any.whl
| Algorithm | Hash digest | |
|---|---|---|
| SHA256 | 400348e61031e3942ad4d4109d18753b2fb08c2f6fb8290671c5513a34182d84 |
|
| MD5 | fad3e16d09ae00191548c86471cb204c |
|
| BLAKE2b-256 | 4926aaca612a0634ceede20682e692a6c55e35a94c21ba36b807cc40fe910ae1 |


