Open-Source Multi Wavelength Galaxy Structure & Morphology
Project description


Installation Guide | readthedocs | Introduction on Binder | HowToGalaxy
The study of a galaxy’s structure and morphology is at the heart of modern day Astrophysical research.
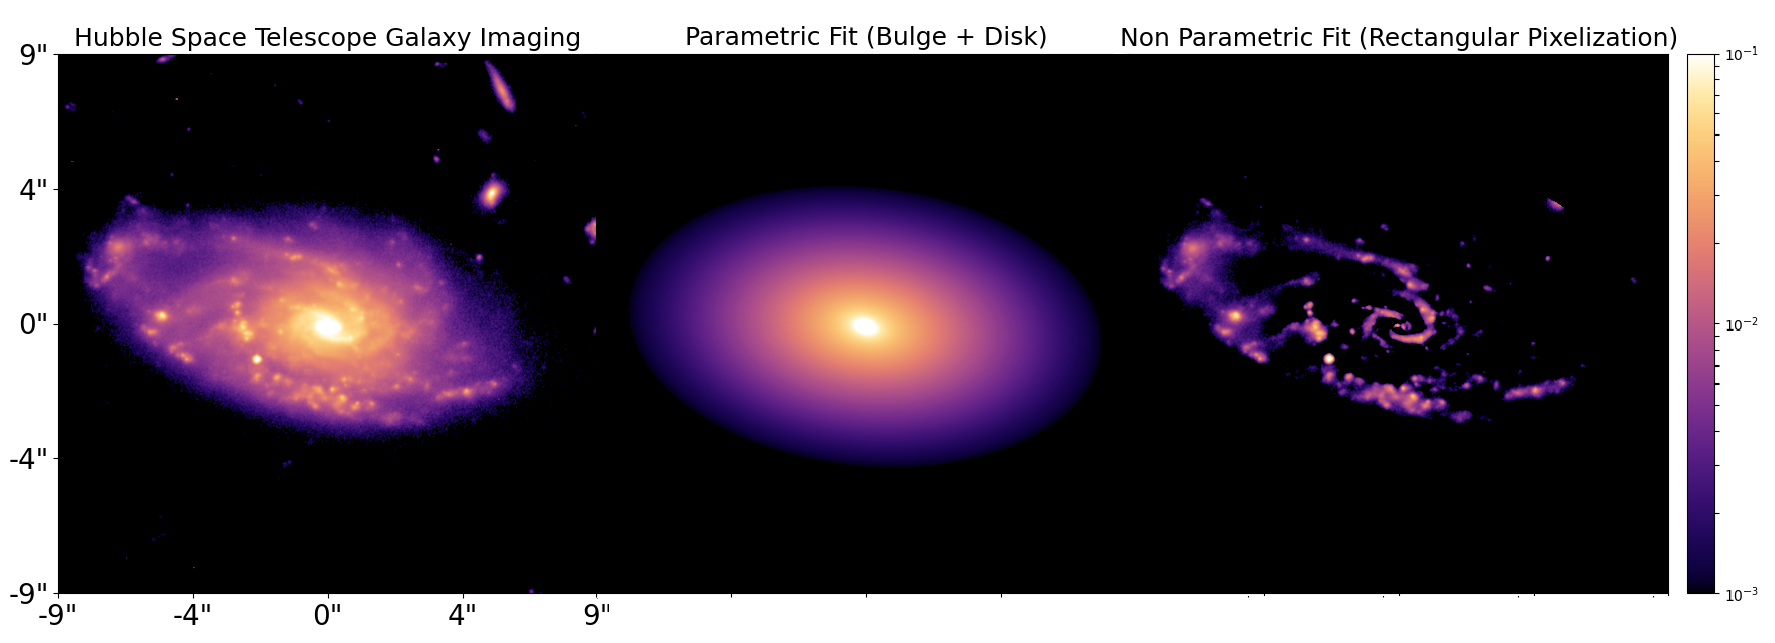
PyAutoGalaxy makes it simple to model galaxies, for example this Hubble Space Telescope imaging of a spiral galaxy:

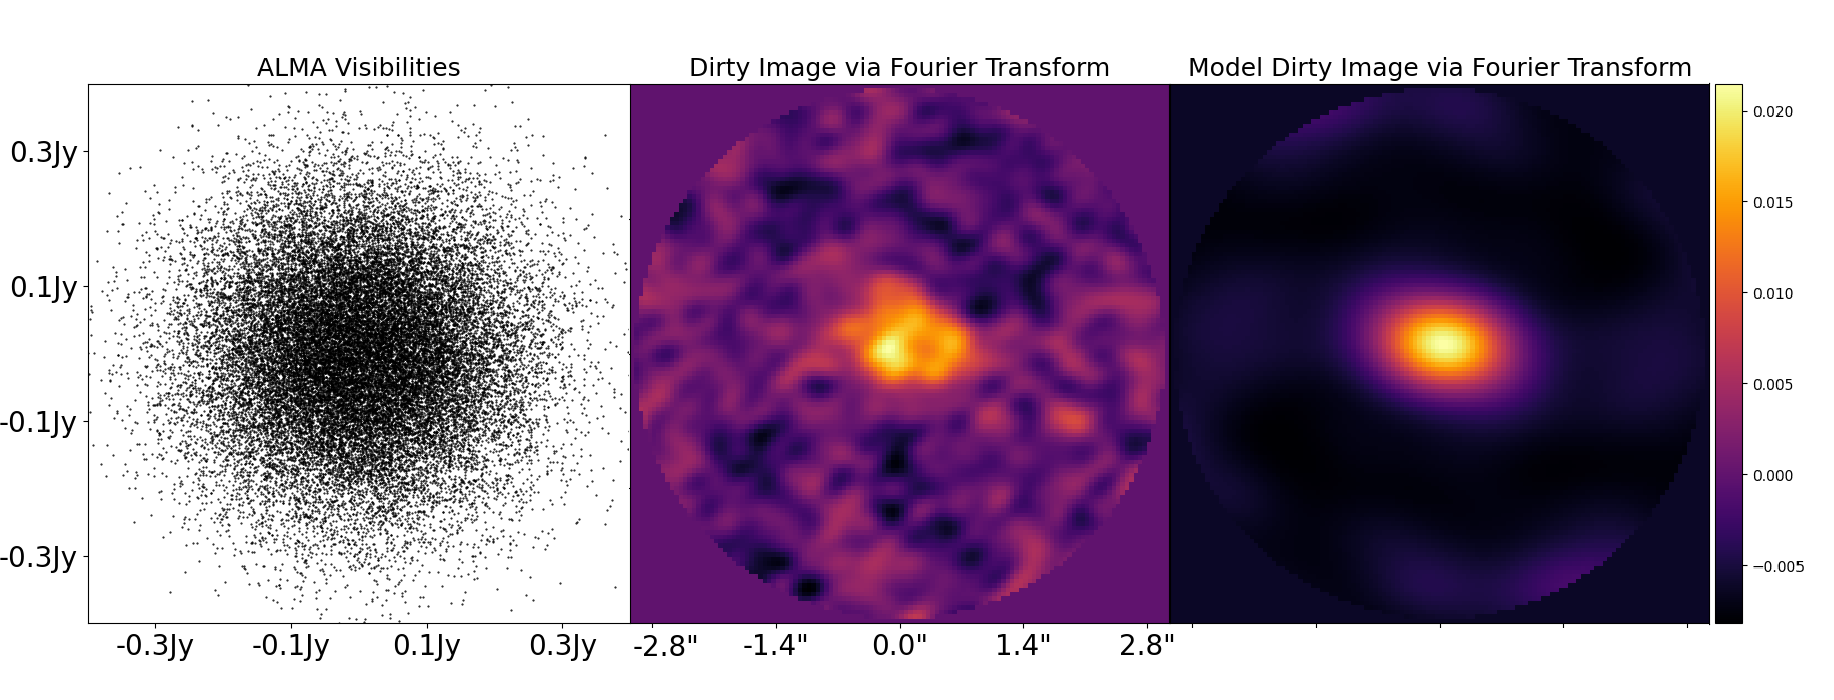
PyAutoGalaxy also fits interferometer data from observatories such as ALMA:

Getting Started
The following links are useful for new starters:
The PyAutoGalaxy readthedocs, which includes an installation guide and an overview of PyAutoGalaxy’s core features.
The introduction Jupyter Notebook on Binder, where you can try PyAutoGalaxy in a web browser (without installation).
The autogalaxy_workspace GitHub repository, which includes example scripts and the HowToGalaxy Jupyter notebook lectures which give new users a step-by-step introduction to PyAutoGalaxy.
API Overview
Galaxy morphology calculations are performed in PyAutoGalaaxy by building a Plane object from LightProfile and Galaxy objects. Below, we create a simple galaxy system where a redshift 0.5 Galaxy with an Sersic LightProfile representing a bulge and an Exponential LightProfile representing a disk.
import autogalaxy as ag
import autogalaxy.plot as aplt

"""
To describe the galaxy emission two-dimensional grids of (y,x) Cartesian
coordinates are used.
"""
grid = ag.Grid2D.uniform(
    shape_native=(50, 50),
    pixel_scales=0.05,  # <- Conversion from pixel units to arc-seconds.
)

"""
The galaxy has an elliptical sersic light profile representing its bulge.
"""
bulge=ag.lp.Sersic(
    centre=(0.0, 0.0),
    ell_comps=ag.convert.ell_comps_from(axis_ratio=0.9, angle=45.0),
    intensity=1.0,
    effective_radius=0.6,
    sersic_index=3.0,
)

"""
The galaxy also has an elliptical exponential disk
"""
disk = ag.lp.Exponential(
    centre=(0.0, 0.0),
    ell_comps=ag.convert.ell_comps_from(axis_ratio=0.7, angle=30.0),
    intensity=0.5,
    effective_radius=1.6,
)

"""
We combine the above light profiles to compose a galaxy at redshift 1.0.
"""
galaxy = ag.Galaxy(redshift=1.0, bulge=bulge, disk=disk)

"""
We create a Plane, which in this example has just one galaxy but can
be extended for datasets with many galaxies.
"""
plane = ag.Plane(
    galaxies=[galaxy],
)

"""
We can use the Grid2D and Plane to perform many calculations, for example
plotting the image of the galaxyed source.
"""
plane_plotter = aplt.PlanePlotter(plane=plane, grid=grid)
plane_plotter.figures_2d(image=True)
With PyAutoGalaxy, you can begin modeling a galaxy in just a couple of minutes. The example below demonstrates a simple analysis which fits a galaxy’s light.
import autofit as af
import autogalaxy as ag

import os

"""
Load Imaging data of the strong galaxy from the dataset folder of the workspace.
"""
dataset = ag.Imaging.from_fits(
    data_path="/path/to/dataset/image.fits",
    noise_map_path="/path/to/dataset/noise_map.fits",
    psf_path="/path/to/dataset/psf.fits",
    pixel_scales=0.1,
)

"""
Create a mask for the data, which we setup as a 3.0" circle.
"""
mask = ag.Mask2D.circular(
    shape_native=dataset.shape_native,
    pixel_scales=dataset.pixel_scales,
    radius=3.0
)

"""
We model the galaxy using an Sersic LightProfile.
"""
light_profile = ag.lp.Sersic

"""
We next setup this profile as model components whose parameters are free & fitted for
by setting up a Galaxy as a Model.
"""
galaxy_model = af.Model(ag.Galaxy, redshift=1.0, light=light_profile)
model = af.Collection(galaxy=galaxy_model)

"""
We define the non-linear search used to fit the model to the data (in this case, Dynesty).
"""
search = af.Nautilus(name="search[example]", n_live=50)

"""
We next set up the `Analysis`, which contains the `log likelihood function` that the
non-linear search calls to fit the galaxy model to the data.
"""
analysis = ag.AnalysisImaging(dataset=masked_dataset)

"""
To perform the model-fit we pass the model and analysis to the search's fit method. This will
output results (e.g., dynesty samples, model parameters, visualization) to hard-disk.
"""
result = search.fit(model=model, analysis=analysis)

"""
The results contain information on the fit, for example the maximum likelihood
model from the Dynesty parameter space search.
"""
print(result.samples.max_log_likelihood())
Support
Support for installation issues, help with galaxy modeling and using PyAutoGalaxy is available by raising an issue on the GitHub issues page.
We also offer support on the PyAutoGalaxy Slack channel, where we also provide the latest updates on PyAutoGalaxy. Slack is invitation-only, so if you’d like to join send an email requesting an invite.
Project details
Release history Release notifications | RSS feed
Download files
Download the file for your platform. If you're not sure which to choose, learn more about installing packages.
Source Distribution
Built Distribution
Hashes for autogalaxy-2024.1.27.4-py3-none-any.whl
| Algorithm | Hash digest | |
|---|---|---|
| SHA256 | 8908b591cfcca0a1458dc702f8eca938bcdf4f68fae9dba9b7aa3541d1f5d7a7 |
|
| MD5 | 52b60e2705e3235997acbe6a535ae2a1 |
|
| BLAKE2b-256 | e45c385c7bd543079c888d325cc38ec980e9290e80b3124eb9a7b2d4ab1ed7ef |


