High-throughput calculation of EC50 values.

Project description

ECCpy, a program for EC50 calculation in python.
The EC50, or the “half maximal effective concentration”, is a key measure of the effectiveness of a compound to affect a biological system. It is commonly used in pharmacology, biology and biochemistry. The EC50 is calculated by fitting the dose-response data to a sigmoidal curve, typically using the Hill equation. Variants include the half maximal “lethal dose” (LD50), and “inhibitor concentration” (IC50).
Features
Robust data analysis
- fully automated
fitting of sigmoidal curves to dose-response data
calculation of EC50, LD50 or IC50 values.
high-throughput analysis
comparison of EC50 values from different experiments
calculation of EC25 or EC75 values
- accepts REAL biological data
pre-filtering excludes nonsense data
judgefit module identifies low-quality EC50 values
Designed for humans
- easy-to-use excel files:
excel settings file
excel input file with dose and response data
excel output file with EC50 values
simple graphical output: - sigmoidal curves with EC50 shown on graph - daily summary barcharts and curves
Customisable
simple python syntax
open-source software
built on powerful numpy, scipy, and pandas packages
Development status
ECCpy has been used extensively for the analysis of LD50 assays by bachelor, master and PhD students within the lab of Dieter Langosch at the Technical University of Munich in Germany. However this software is released “as is”, and may contain bugs related to particular data types, python versions or operating systems.
Installation
pip install eccpy
ECCpy is written for python 3. We recommend the Anaconda python distribution, which contains all the required python packages (numpy, scipy, pandas and matplotlib). If you encounter dependency issues, we suggest creating a python virtual environment with conda or virtualenv, and installing the exact package versions specified in the requirements.txt
Usage
As described in the wiki, ECCpy requires only the following three steps:
- 1) Prepare your data.
use the excel or microplate templates in the eccpy/templates folder
for the generic excel format, simply open the template and paste in your dose and response data.
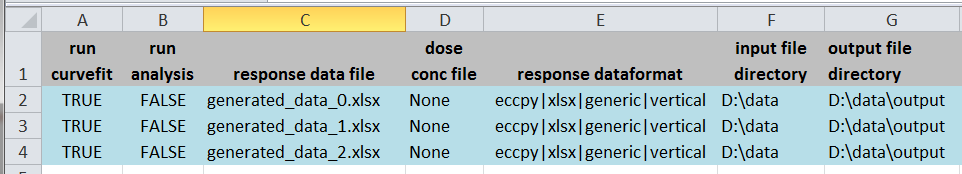
- 2) Update an excel settings file
copy the ECCpy_settings_template.xlsx from eccpy/templates
open the excel file, input the name and location of your datafiles, and the desired location for your output files
write “TRUE” next to the files you want to examine
- 3) Run ECCpy
run the ipython/jupyter notebook, which opens a python interpreter in your web browser
paste in the following four lines. Replace the location of your settings file.
hit Ctrl-Enter to run
based on your output, adjust the quality thresholds in the settings file to suit your data
Example:
import eccpy
settings = r"D:\data\ECCpy_settings.xlsx"
eccpy.run_curvefit(settings)
eccpy.run_gatherer(settings)
Test
before processing your own data, run eccpy on the provided example files provided, following the instructions in the ECCpy wiki.
example data is available in eccpy/examples/example_data
example settings are available in eccpy/examples/example_settings
TIP: when downloading ECCpy from github, run
pytestin the ECCpy repository directory to automatically start functional tests
ECCpy output
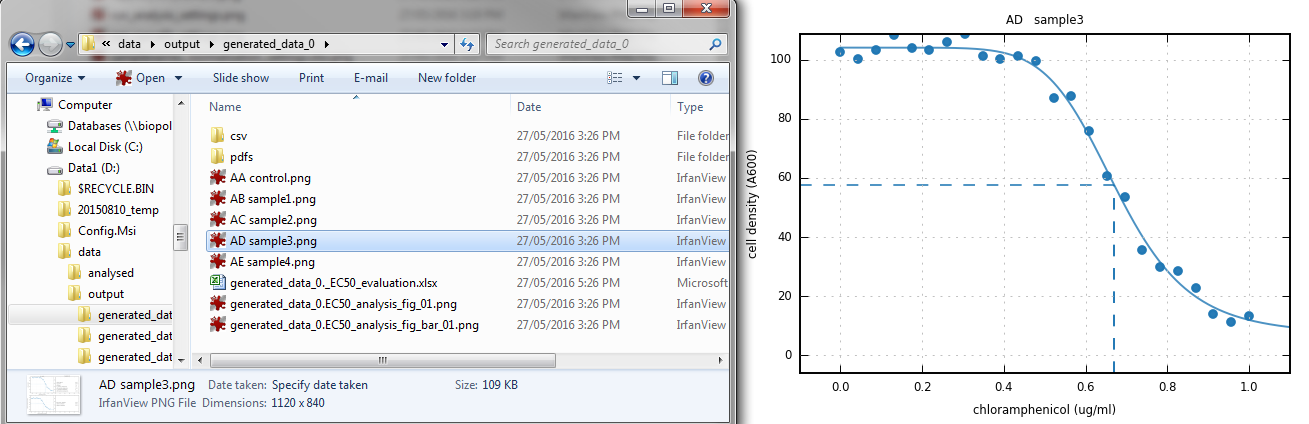
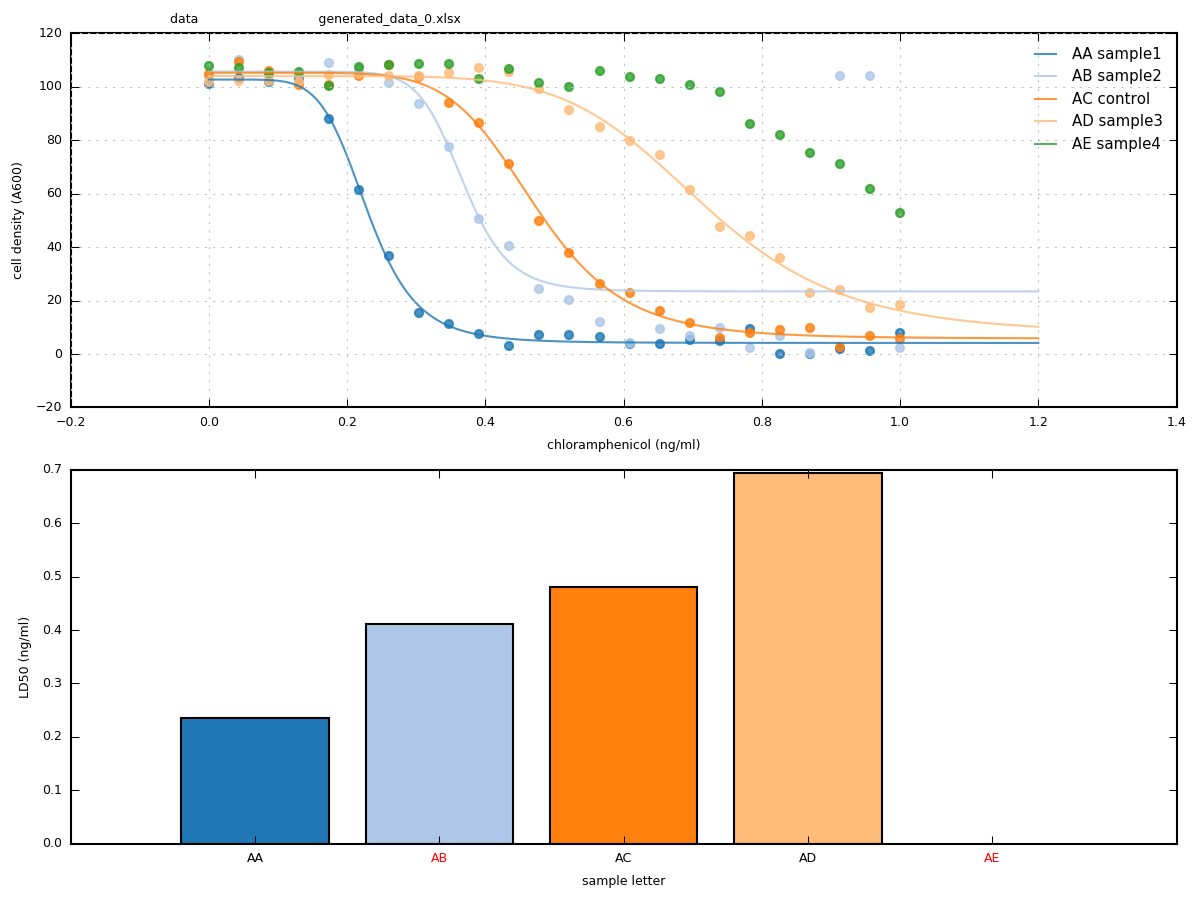
- run_curvefit program
individual dose-response curves
automatic judging of data quality
daily summary curves, barchart and more!
run_gatherer program
combines data from multiple experiments
excludes EC50 values that are not of sufficient quality, according to user-defined thresholds
bar charts with mean and SEM over all selected experiments
scatter plots showing individual datapoints for each day/experiment, and more!
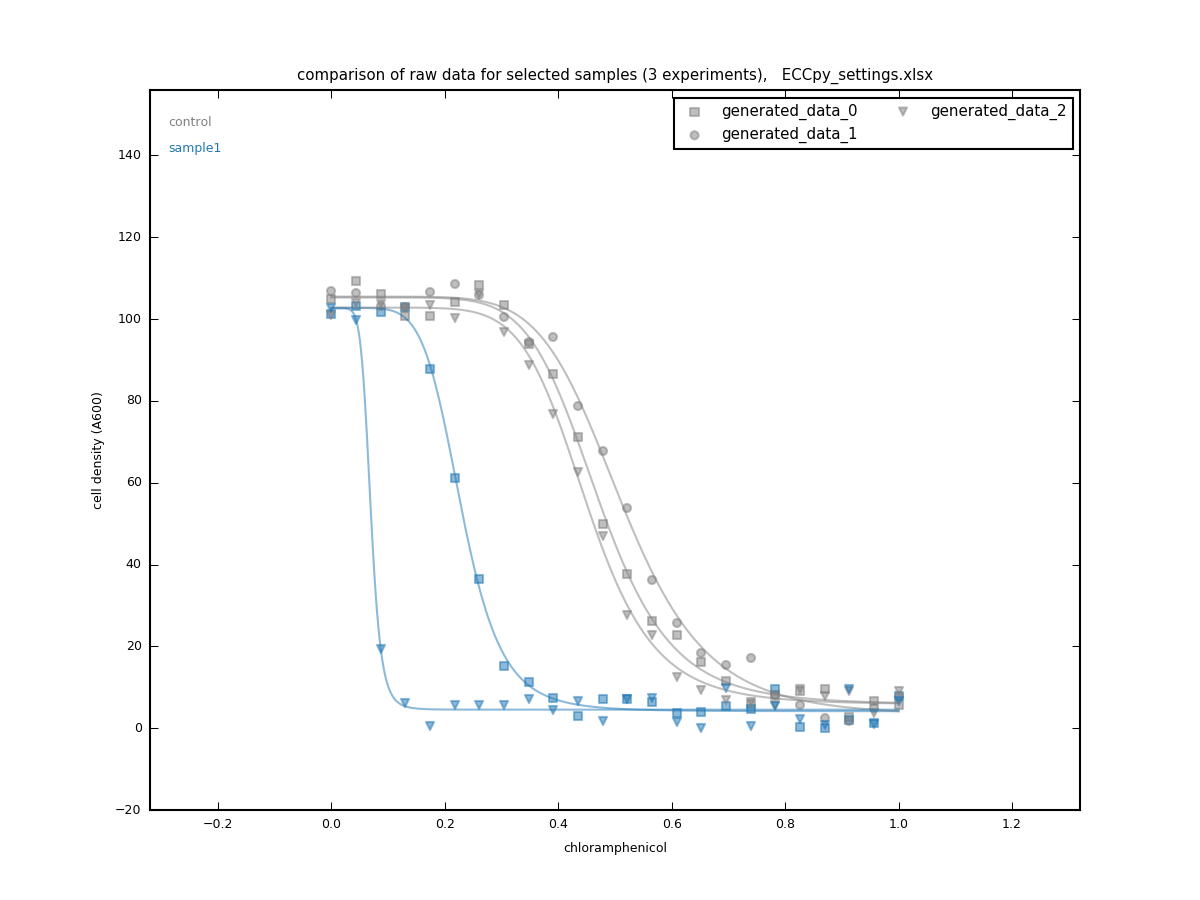
compare_rawdata program
collects raw data and dose-response curves from multiple experiments
compares datapoints and fitted curves between the selected samples
Contribute
If you encounter a bug or ECCpy doesn’t work for any reason, please send an email to Mark Teese (contact details below) or initiate an issue in Github.
- Non-programmers can contribute by:
testing ECCpy with your particular datasets
suggesting features
improving the readme and documentation
Pull requests are also very welcome.
License
ECCpy is free software distributed under the permissive MIT license.
Releases
Release-notes are found in /docs/releases.rst
Citation
If you use ECCpy in your research, please use the following citation.
Schanzenbach C, Schmidt FC, Breckner P, Teese MG, & Langosch D (2017) Identifying ionic interactions within a membrane using BLaTM, a genetic tool to measure homo-and heterotypic transmembrane helix-helix interactions. Scientific Reports 7(7):43476.
Contact
ECCpy is currently maintained by Mark Teese of TNG Technology Consulting GmbH, formerly of the Langosch lab of the Technical University of Munich.
For contact details, see the image below.

Release history Release notifications | RSS feed


Download files
Download the file for your platform. If you're not sure which to choose, learn more about installing packages.


