Plot potentiostatic data

Project description
Plotpot is a Python module that plots half and full cell potentiostatic data automatically imported with Convpot. It keeps a journal with meta information such as mass of active material, capacity etc. for later use.
Getting Started
Prerequisites
Plotpot is based on the following software:
To get the Python environment running under Windows I recommend to use a scientific Python distribution such as Anaconda or Enthought Canopy, which include a precompiled version of NumPy and Matplotlib.
Installing
To install Plotpot follow these steps (tested under Windows 7 64 bit as a normal user):
Download and install the latest Convpot package. During installation choose to add Convpot to the PATH of the current user.
Download and install Anaconda. Choose the Python 3 64 bit version and install “Just for me”.
Update Anaconda. Open an “Anaconda Prompt” and type:
conda update conda
conda update anaconda
Create a new virtual Python environment just for running Plotpot:
conda create -n plotpot-env numpy matplotlib
activate plotpot-env
Create a shortcut for plotpot-env on the desktop as described in the wiki.
Download and install (or upgrade) Plotpot by typing:
pip install plotpot --upgrade
If all goes well you should be able to type plotpot and get a usage message without errors about missing packages.
Usage
Plotpot currently knows two sub-commands show, merge and journal. A detailed help of the sub-command options are printed with plotpot <sub-command> -h
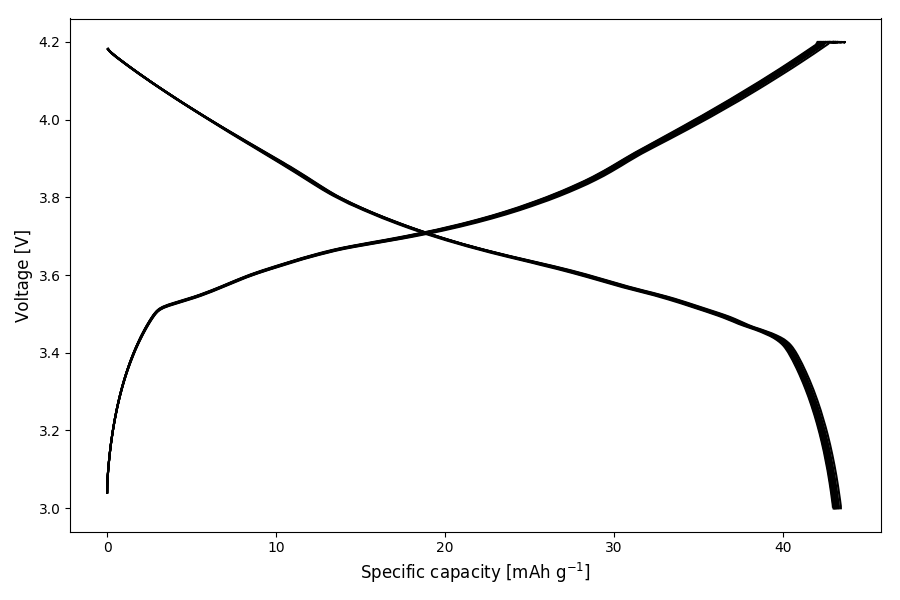
An example plot generated with plotpot show arbintest.res looks like this:
Select data
By default all available data is plotted. The range can be selected by
cycle number (--cycles)
time (in hours) (--time)
data points (--data)
For example to plot data up to cycle 5:
plotpot show arbintest.res --cycles 5
To plot from cycle 2 to 10:
plotpot show arbintest.res --cycles 2,10
Select plots
Plots are selected with the --plot option, e.g.
plotpot show arbintest.res --cycles 2,10 --plot 8-9,14
It is possible to give a comma separated list of plots and ranges separated with “-”. If no plots are selected, the voltage versus specific capacity (1) is plotted by default. Plotpot currently supports the following plot types:
Specific capacity
Specific capacity (circle plot)
Voltage and current
Temperature
dQ/dV
Specific capacity [mAh/g]
Volumetric capacity [Ah/L]
Specific energy [Wh/kg]
Volumetric energy [Wh/L]
Specific current density [mA/g]
Current density [mA/cm²]
C-rate
Hysteresis
Coulombic efficiency
Smooth dQ/dV plot
Plotpot has the option to smooth the dQ/dV plot by convoluting the raw data with a Hanning window of certain width. The smoothing strength is chosen with the level parameter ranging from 1 to 5, which translates to the widths of the window.
plotpot show arbintest.res --cycle 2,2 --plot 5 --smooth 2
Export data
The raw data, statistics, voltage profile and battery properties are exported with
plotpot show arbintest.res --export
This generates files in csv format for further processing with e.g. Microcal Origin or similar software. Data per cycle is packed into a zip archive and png snapshots of the plots genererated on screen are created.
Merge Files
A battery which consists of many individual data files (which is common for the Gamry instruments) can be merged together to a single data file with the “merge” sub-command.
To process multiple files
plotpot merge gamrytest_1.DTA gamrytest_2.DTA
Alternatively, the files to merge can be given in a text file listed one by line. Lines starting with the “!” character are ignored.
plotpot merge --list gamrytest.txt
The output file name can be changed with the --output option.
The journal
On first execution, a journal file plotpot-journal.dat is created in the directory of the plotpot executable. The folder location can be changed by setting the PLOTPOT_JOURNAL environment variable to a full path as described in the wiki.
The journal file keeps a record of mass, capacity, area, volume and mass loading of the electrode. If plotpot is called with the same data file, you have the possibility to use the previously entered values or enter new ones. The content of the journal is displayed with
plotpot journal
A particular entry can be removed from the journal with:
plotpot journal --delete <row_ID>
The individual raw data files of a merged battery can be shown with
plotpot journal --show <row_ID>
The journal file can be exported to a csv file:
plotpot journal --export
Changelog
All notable changes and releases are documented in the CHANGELOG.
License
This project is licensed under the MIT license - see the LICENSE file for details
Release history Release notifications | RSS feed

Download files
Download the file for your platform. If you're not sure which to choose, learn more about installing packages.


