Analyze large datasets of point clouds recorded over time in an efficient way
Project description
Analyze large datasets of point clouds recorded over time in an efficient way.


Features
Handles point clouds over time
Building complex pipelines with a clean and maintainable code
newpointcloud = pointcloud.limit("x",-5,5).filter("quantile","reflectivity", ">",0.5)Apply arbitrary functions to datasets of point clouds
def isolate_target(frame: PointCloud) -> PointCloud:
   return frame.limit("x",0,1).limit("y",0,1)

def diff_to_pointcloud(pointcloud: PointCloud, to_compare: PointCloud) -> PointCloud:
   return pointcloud.diff("pointcloud", to_compare)

result = dataset.apply(isolate_target).apply(diff_to_pointcloud, to_compare=dataset[0])
Includes powerful aggregation method agg similar to pandas
dataset.agg(["min","max","mean","std"])Support for large files with lazy evaluation and parallel processing

Support for numerical data per point (intensity, range, noise …)
Interactive 3D visualisation

High level processing based on dask, pandas, open3D and pyntcloud
Docker image is available
Optimised - but not limited to - automotive lidar
Directly read ROS files and many pointcloud file formats
A command line tool to convert ROS 1 & 2 files
Use case examples
Post processing and analytics of a lidar dataset recorded by ROS
A collection of multiple lidar scans from a terrestrial laser scanner
Comparison of multiple point clouds to a ground truth
Analytics of point clouds over time
Developing algorithms on a single frame and then applying them to huge datasets
Installation with pip
Install python package with pip:
pip install pointcloudsetInstallation with Docker
The easiest way to get started is to use the pre-build docker tgoelles/pointcloudset or use tgoelles/pointcloudset_base to get a container with all dependencies and install pointcloudset there.
Quickstart
from pointcloudset import Dataset, PointCloud
from pathlib import Path
import urllib.request

urllib.request.urlretrieve("https://github.com/virtual-vehicle/pointcloudset/raw/master/tests/testdata/test.bag", "test.bag")
urllib.request.urlretrieve("https://github.com/virtual-vehicle/pointcloudset/raw/master/tests/testdata/las_files/test_tree.las", "test_tree.las")

dataset = Dataset.from_file(Path("test.bag"), topic="/os1_cloud_node/points", keep_zeros=False)
pointcloud = dataset[1]
tree = PointCloud.from_file(Path("test_tree.las"))

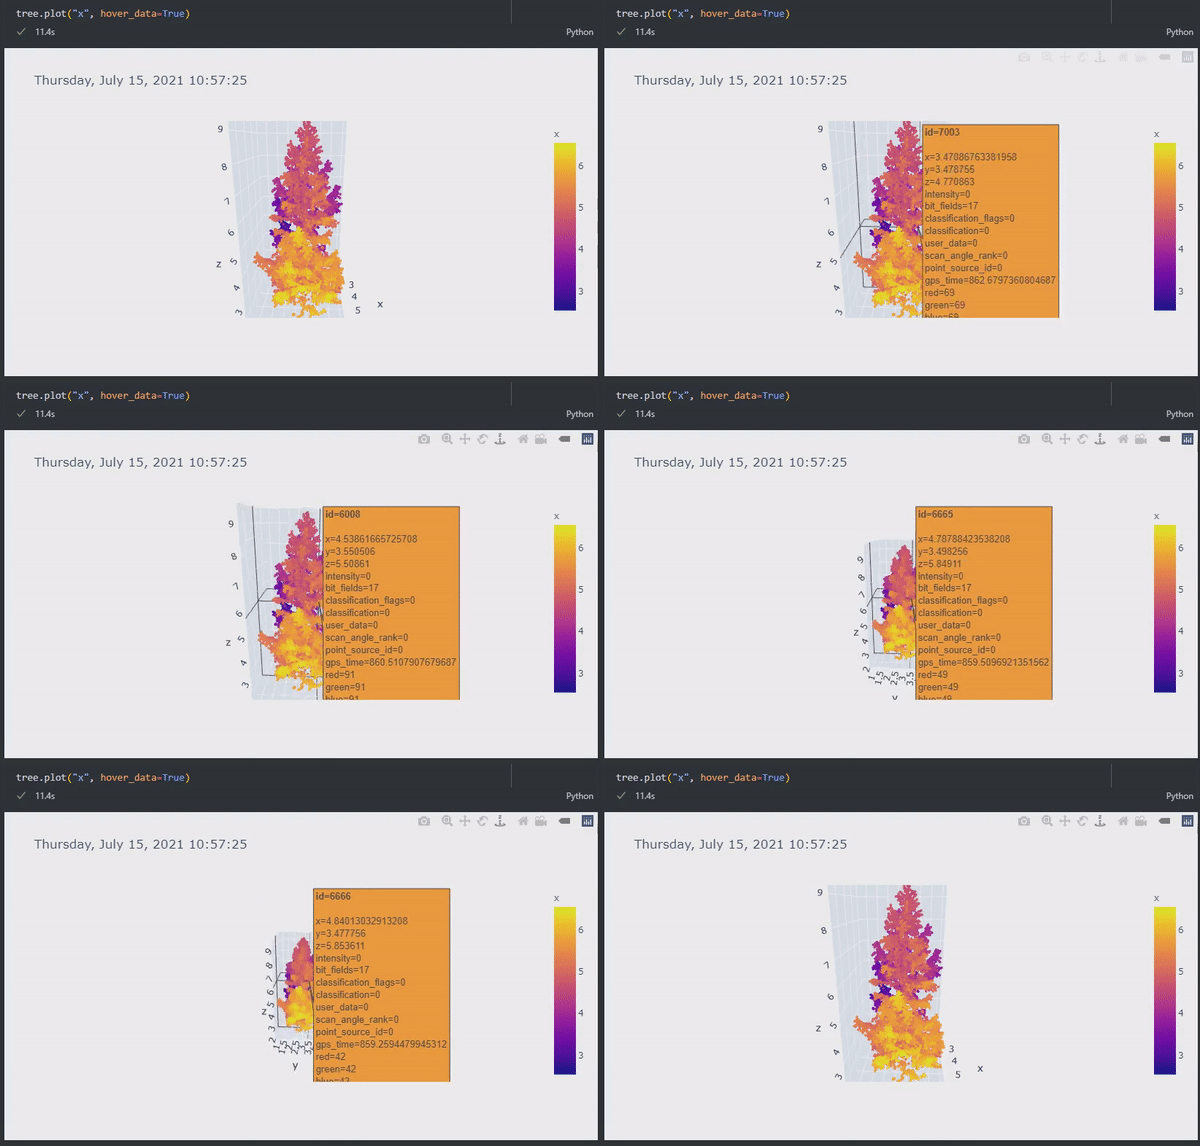
tree.plot("x", hover_data=True)
This produces the plot from the animation above.
Read the html documentation.
Have a look at the tutorial notebooks in the documentation folder
For even more usage examples you can have a look at the tests
CLI to convert ROS1 and ROS2 files: pointcloudset convert
The package includes a powerful CLI to convert pointclouds in ROS1 & 2 files into many formats like pointcloudset, csv, las and many more. It is capable of handling both mcap and db3 ROS files.
pointcloudset convert --output-format csv --output-dir converted_csv test.bag
You can view PointCloud2 messages with
pointcloudset topics test.bagCitation and contact

Please cite our JOSS paper if you use pointcloudset.
@article{Goelles2021,
  doi = {10.21105/joss.03471},
  url = {https://doi.org/10.21105/joss.03471},
  year = {2021},
  publisher = {The Open Journal},
  volume = {6},
  number = {65},
  pages = {3471},
  author = {Thomas Goelles and Birgit Schlager and Stefan Muckenhuber and Sarah Haas and Tobias Hammer},
  title = {`pointcloudset`: Efficient Analysis of Large Datasets of Point Clouds Recorded Over Time},
  journal = {Journal of Open Source Software}
}


