Ultra-fast analysis and interactive visualization of population structure plots from Structure/Admixture data


Project description
This document serves as a quick-start guide and reference card for installing and using pong. Please refer to the software manual for comprehensive information.
Installing pong
pong has been tested on macOS (10.8-11), Linux (Ubuntu 15.04, Linux Mint 17.2), and Windows 7.
pong is hosted on PyPI and can thus be easily installed with pip. In order to run pong, you need Python 3 (version 3.6 or newer) and a modern web browser.
To install pong, run:
pip3 install pong
Note to Python 2 users: Older versions of pong run on Python 2.7. The latest version of pong compatible with Python 2 can be installed with pip install pong==1.4.9
Linux-specific tips
On some Linux systems, the install command may fail due to a permissions error. In that case, try running sudo pip install pong instead. You will be prompted to enter in your computer login password. If that doesn't work either, try running the command as the super user:
su # you will be prompted to enter an administrator password
pip install pong
exit
Mac-specific tips
Note that the Apple system default Python cannot run pong. Python 3 and pip can be installed manually, but we find that setup is easiest if you use (mini)conda or Homebrew. For example:
# If you have Miniconda (or Anaconda)
conda install python
conda install pip
pip install pong

# Or, if you don't want to install pong in your base environment
conda create -n my-pong-env python pip
conda activate my-pong-env
pip install pong

# Or, using Homebrew
brew install python 	[ brew upgrade python ]
pip install pip 		[ pip install --upgrade pip ]
pip install pong		[ pip install --upgrade pong ]
Running pong
pong is executed through the command line. To see a complete list of options, run:
pong -h
Note to Windows users: On some Windows systems, pong may not be installed as an executable, and thus cannot be run using this command. Instead, replace pong with python3 \path\to\pong.
We have provided an example dataset on which you can run pong (available on GitHub or the Ramachandran Lab website). Using data from the 1000 Genomes Project Phase3 (2,426 individuals), we performed 8 runs of ADMIXTURE at each value of K from K=2 to K=8. To analyze the example dataset with pong, navigate to the unzipped example directory and run:
pong -m pong_filemap -i ind2pop.txt -n pop_order_expandednames.txt
Information regarding pong's application to the input data will be displayed to your terminal window. After its algorithms complete, pong initializes a web server on localhost:4000 (you can change the port on which pong operates with the command line option --port). Once you navigate to localhost:4000 on your web browser, pong will detect a new browser connection and begin rendering the visualization.
Example screenshot:
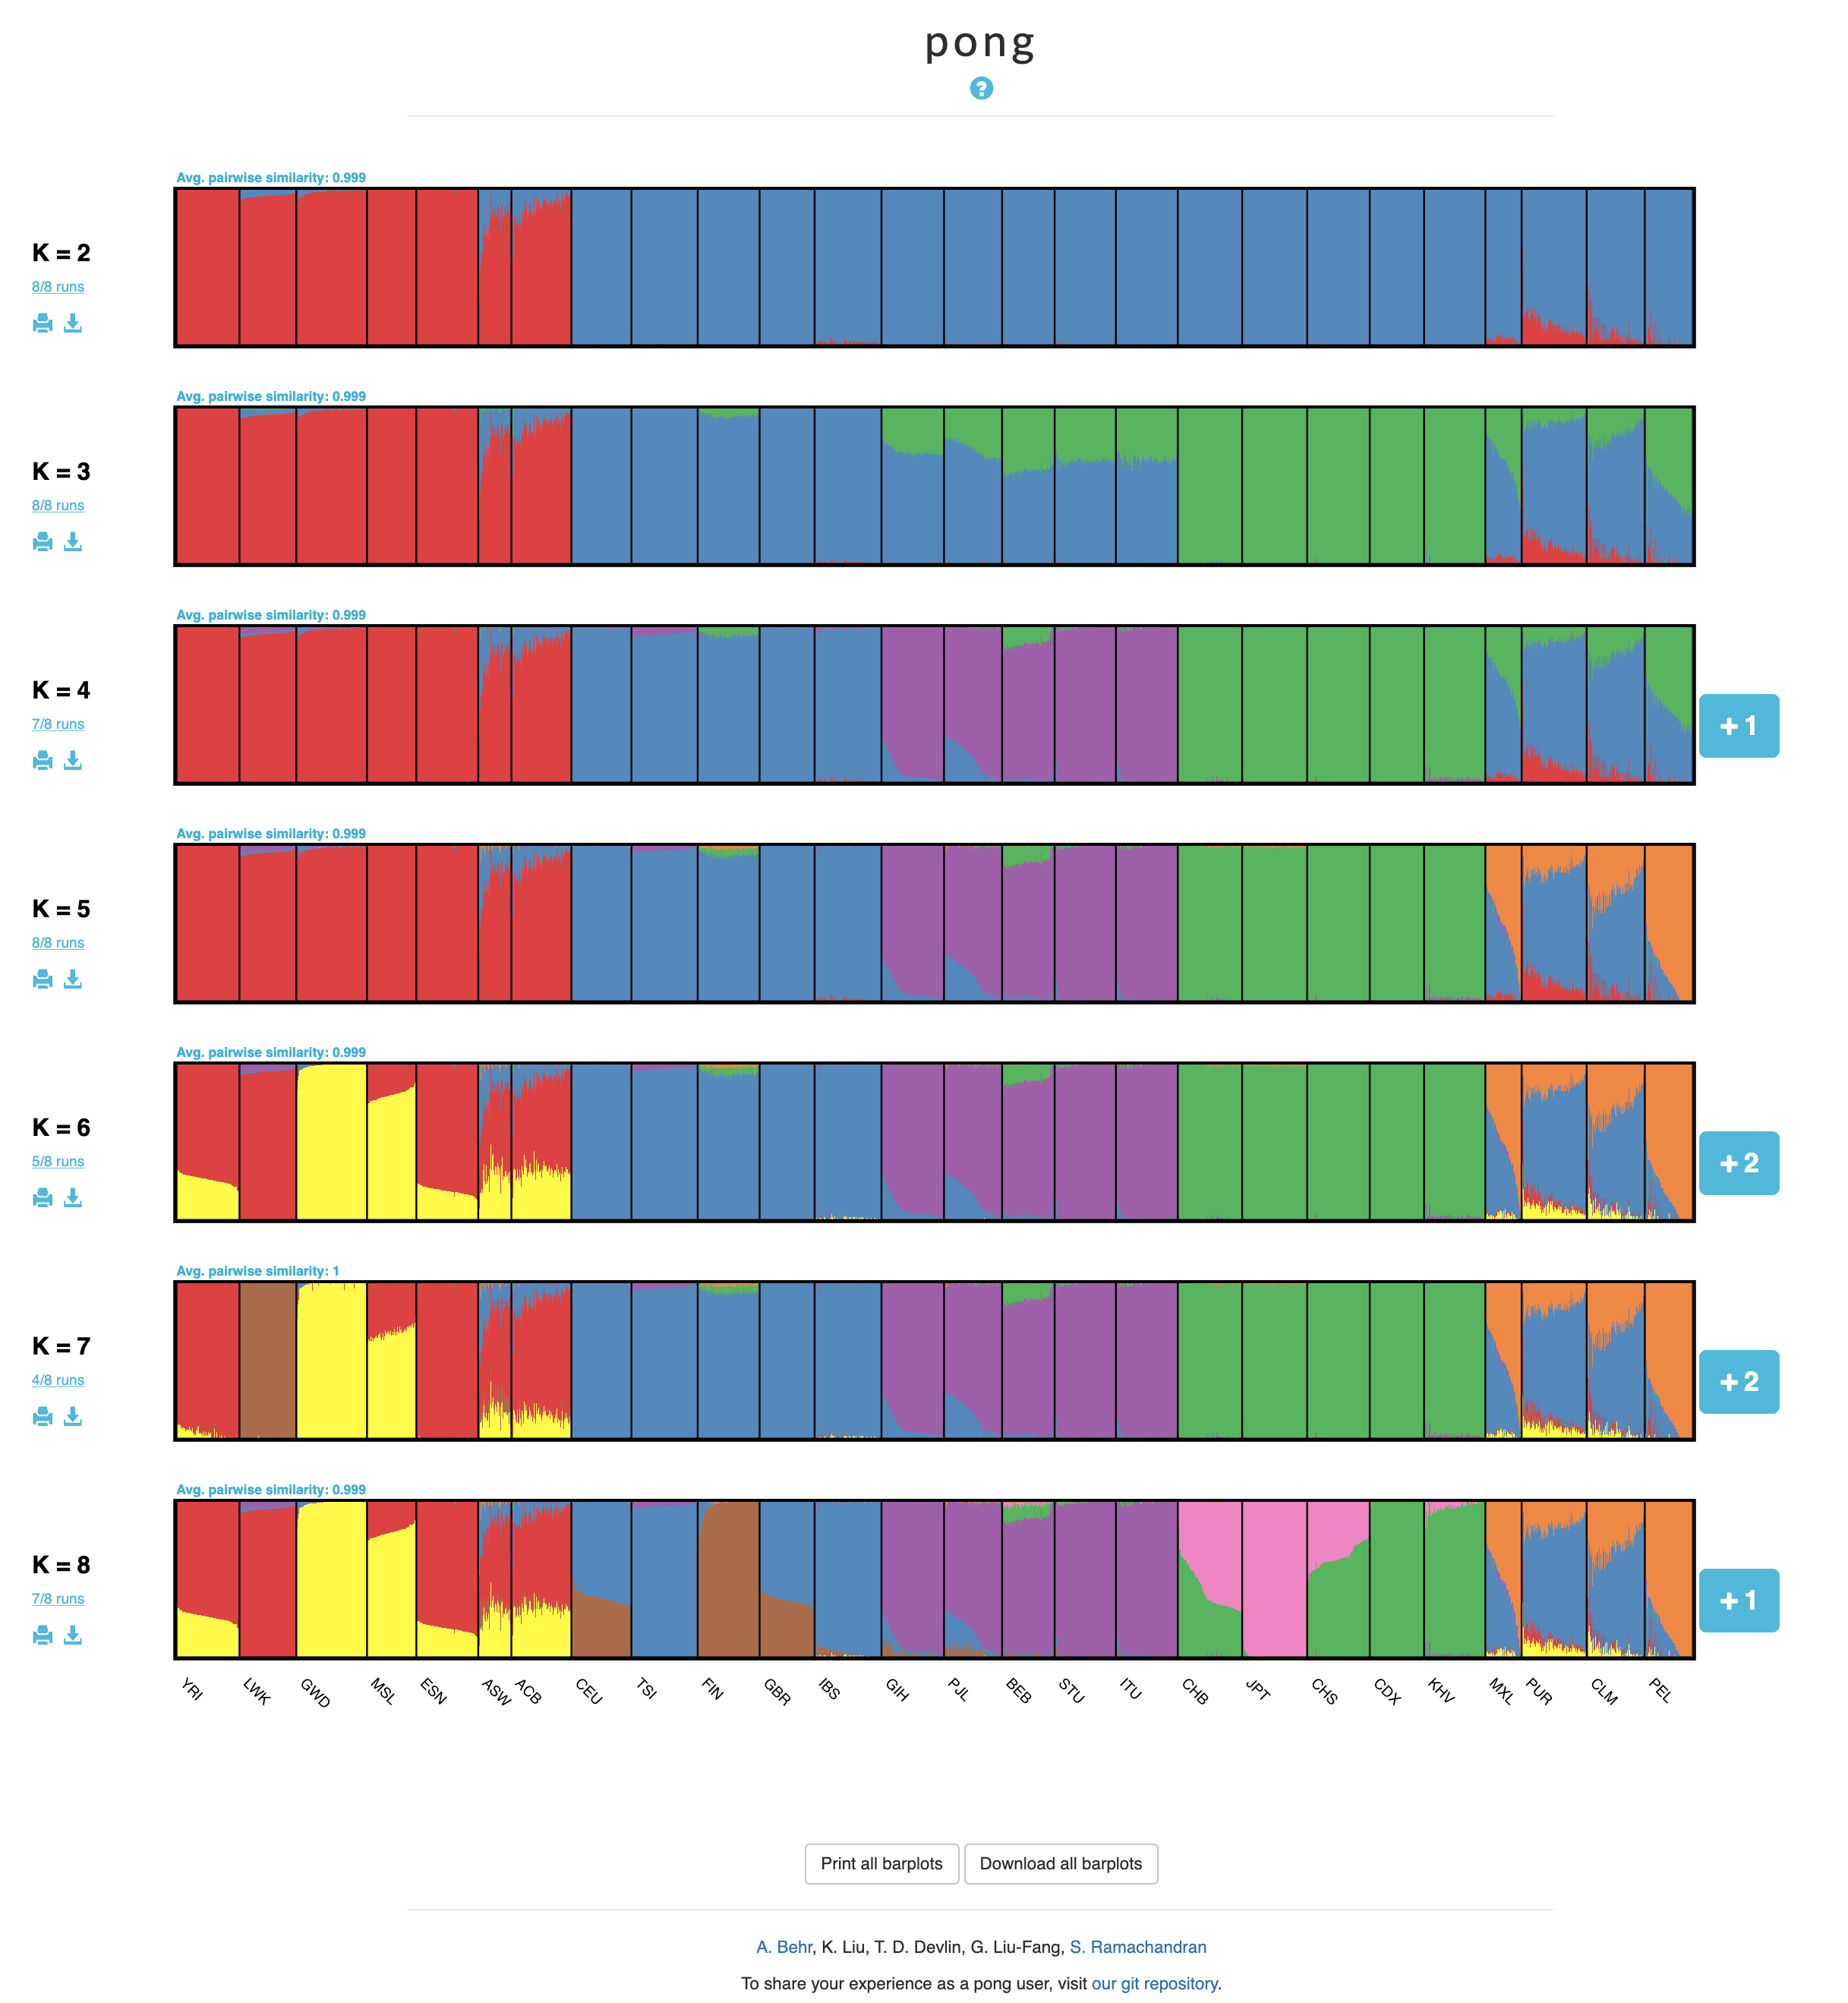
Tip: Click on the question mark at the top of the screen for a quick tutorial on how to interact with pong's web app (including highlighting multimodality and downloading plots).
Running pong on your own data
pong's setup is designed to be low-hassle. This section details the required and optional input files that pong handles.
Clustering output
pong accepts clustering output files, or Q matrices, from a variety of clustering inference programs. The command line option -c, or --ignore_cols, tells pong how many leading columns of each row of the input Q matrix files to skip before parsing individual membership coefficients. For example, use -c 5 for some versions of Structure
indiv output to ignore covariate metadata. In the case that no leading columns should be skipped (e.g. for ADMIXTURE output), it is not necessary to provide -c 0 because the default value of -c is 0.
A few related notes:
- Don't worry about trailing columns; they will not be parsed (after
-cleading columns are ignored, only the first K columns are used). - pong parses Q matrix files as whitespace-delimited by default. If, for some reason, this is not the case with your input data, you can specify any column delimiter with the option
--col_delim(e.g.--col_delim ","for CSV files, or--col_delim "\t"for tab-delimited files). - While pong does handle leading/trailing columns in Q matrices, it does not handle leading/trailing rows. These rows must be stripped prior to analysis with pong (i.e. for a dataset with n samples, every Q matrix file should have n lines).
filemap file
A bit of information about the input Q matrices must be provided, in the form of a filemap. A filemap is a three-column, tab-delimited file. Each line contains the following information about a single Q matrix:
- A unique ID (e.g.
iter5_K=7; this must contain at least one letter, and cannot contain a hashmark/hashtag or a period. Integers, spaces, and other special characters are accepted.) - The K value
- The Q matrix file path, relative to the filemap. Thus, if the filemap is in the same directory as the Q matrix files, this is just the name of the Q matrix file.
It is important that the columns of your filemap are in the right order and that the file is tab-delimited. Use the filemap provided with the example dataset for reference. Use the command line option -m, or --filemap, to pass pong the path to your your filemap.
Population labels (optional)
ind2pop data:
It is common for Q matrices to be annotated with population metadata. In many datasets, individuals are assigned a population code/label/number; we refer to this as ind2pop data. If provided with this information, pong's visualization will sort individuals by population, partition populations with black lines, and sort individuals within each population by their membership in the population's major cluster.* Other covariates, such as continent or language spoken, can also be used as ind2pop in place of population metadata.
You can provide ind2pop data with the command line option -i, or --ind2pop. The argument to this option can be either of the following:
- An integer, representing the Q matrix column number that contains ind2pop data. For example, use
-i 4for standard Structure output. - The path to an ind2pop file, where line i of this file contains the ind2pop data (i.e. population code/label/number) for the individual represented by line i of the Q matrix files.
Note that the population codes/labels/numbers provided as ind2pop data should not contain any whitespace.
Population order and detailed names:
If you provide ind2pop data, you may provide an additional file specifying the desired order in which to display the populations (as the argument to the command line option -n). This file should have one population code/label/number per line; the top-to-bottom order of the file corresponds with the left-to-right display order of the populations.
You may want to more descriptive population names to be displayed (e.g. if the input ind2pop data are numbers, cryptic three-letter codes, etc.); in this case, you can add a second column (tab-delimited) to the population order file containing population names. Space characters are allowed in these names. See the file pop_order_expandednames.txt in the example dataset for reference.
Custom colors for visualization (optional)
pong provides default colors (unless K_max > 26), but it is possible to provide pong with a file containing a set of colors to use for visualization (using the command line option -l). This file must contain at least K_max colors, with one color per line. Because pong's visualization is web-based, colors can be provided in any format that is accepted by CSS (e.g. #ff0000, rgb(255,0,0), red).
Additional resources
The example dataset, software manual, and other relevant materials can be found at the Ramachandran Lab website.
Contact Aaron Behr or Sohini Ramachandran for more information.
*We have found that this sorting operation makes it much easier to understand the distribution of cluster membership within each population. Note that pong performs this sorting operation on a single Q matrix (the bottom-most plot in the main visualization, which is the representative run of the major mode of the highest K-value) and propagates that order through all the other visualized Q matrices, such that the ordering of individuals is consistent across all plots.
Release history Release notifications | RSS feed


Download files
Download the file for your platform. If you're not sure which to choose, learn more about installing packages.


