Access topography data at any resolution via 3DEP web service of USGS.

Project description


Package |
Description |
Status |
|---|---|---|
Navigate and subset NHDPlus (MR and HR) using web services |
||
Access topographic data through National Map’s 3DEP web service |
||
Access NWIS, NID, WQP, eHydro, NLCD, CAMELS, and SSEBop databases |
||
Access daily, monthly, and annual climate data via Daymet |
||
Access daily climate data via GridMET |
||
Access hourly NLDAS-2 data via web services |
||
A collection of tools for computing hydrological signatures |
||
High-level API for asynchronous requests with persistent caching |
||
Send queries to any ArcGIS RESTful-, WMS-, and WFS-based services |
||
Utilities for manipulating geospatial, (Geo)JSON, and (Geo)TIFF data |


Py3DEP: Topographic data through 3DEP


Features
Py3DEP is a part of HyRiver software stack that is designed to aid in hydroclimate analysis through web services. This package provides access to the 3DEP database which is a part of the National Map services. The 3DEP service has multi-resolution sources and depending on the user-provided resolution, the data is resampled on the server-side based on all the available data sources. Py3DEP returns the requests as xarray dataset.
The following functionalities are currently available:
get_map: Get topographic data the dynamic 3DEP service that supports the following layers:
DEM
Hillshade Gray
Aspect Degrees
Aspect Map
GreyHillshade Elevation Fill
Hillshade Multidirectional
Slope Degrees
Slope Map
Hillshade Elevation Tinted
Height Ellipsoidal
Contour 25
Contour Smoothed 25
static_3dep_dem: Get DEM data at 10 m, 30 m, or 60 m resolution from the staged 3DEP data. Since this function only returns DEM, for computing other terrain attributes you can use xarray-spatial. Just note that you should reproject the output DataArray to a projected CRS like 5070 before passing it to xarray-spatial like so: dem = dem.rio.reproject(5070).
get_dem: Get DEM data from either the dynamic or static 3DEP service. Considering that the static service is much faster, if the target DEM resolution is 10 m, 30 m, or 60 m, then the static service is used (static_3dep_dem). Otherwise, the dynamic service is used (get_map using DEM layer).
get_map_vrt: Get DEM data and store it as a GDAL VRT file from the dynamic 3DEP service. This function is mainly provided for large requests due to its low memory footprint. Moreover, due to lazy loading of the data this function can be much faster than get_map or get_dem, even for small requests at the cost of higher disk usage.
elevation_bygrid: For retrieving elevations of all the grid points in a 2D grid.
add_elevation: For adding elevation data as a new variable to an input xarray.DataArray or xarray.Dataset.
elevation_bycoords: For retrieving elevation of a list of x and y coordinates.
elevation_profile: For retrieving elevation profile along a line at a given spacing. This function converts the line to a B-spline and then calculates the elevation along the spline at a given uniform spacing.
deg2mpm: For converting slope dataset from degree to meter per meter.
query_3dep_sources: For querying bounds of 3DEP’s data sources within a bounding box.
check_3dep_availability: For querying 3DEP’s resolution availability within a bounding box.
You can find some example notebooks here.
Moreover, under the hood, Py3DEP uses PyGeoOGC and AsyncRetriever packages for making requests in parallel and storing responses in chunks. This improves the reliability and speed of data retrieval significantly.
You can control the request/response caching behavior and verbosity of the package by setting the following environment variables:
HYRIVER_CACHE_NAME: Path to the caching SQLite database for asynchronous HTTP requests. It defaults to ./cache/aiohttp_cache.sqlite
HYRIVER_CACHE_NAME_HTTP: Path to the caching SQLite database for HTTP requests. It defaults to ./cache/http_cache.sqlite
HYRIVER_CACHE_EXPIRE: Expiration time for cached requests in seconds. It defaults to one week.
HYRIVER_CACHE_DISABLE: Disable reading/writing from/to the cache. The default is false.
HYRIVER_SSL_CERT: Path to a SSL certificate file.
For example, in your code before making any requests you can do:
import os

os.environ["HYRIVER_CACHE_NAME"] = "path/to/aiohttp_cache.sqlite"
os.environ["HYRIVER_CACHE_NAME_HTTP"] = "path/to/http_cache.sqlite"
os.environ["HYRIVER_CACHE_EXPIRE"] = "3600"
os.environ["HYRIVER_CACHE_DISABLE"] = "true"
os.environ["HYRIVER_SSL_CERT"] = "path/to/cert.pem"
You can also try using Py3DEP without installing it on your system by clicking on the binder badge. A Jupyter Lab instance with the HyRiver stack pre-installed will be launched in your web browser, and you can start coding!
Moreover, requests for additional functionalities can be submitted via issue tracker.
Citation
If you use any of HyRiver packages in your research, we appreciate citations:
@article{Chegini_2021,
    author = {Chegini, Taher and Li, Hong-Yi and Leung, L. Ruby},
    doi = {10.21105/joss.03175},
    journal = {Journal of Open Source Software},
    month = {10},
    number = {66},
    pages = {1--3},
    title = {{HyRiver: Hydroclimate Data Retriever}},
    volume = {6},
    year = {2021}
}
Installation
You can install Py3DEP using pip after installing libgdal on your system (for example, in Ubuntu run sudo apt install libgdal-dev). Moreover, Py3DEP has an optional dependency for using persistent caching, requests-cache. We highly recommend installing this package as it can significantly speed up send/receive queries. You don’t have to change anything in your code, since Py3DEP under-the-hood looks for requests-cache and if available, it will automatically use persistent caching:
$ pip install py3depAlternatively, Py3DEP can be installed from the conda-forge repository using Conda:
$ conda install -c conda-forge py3depQuick start
You can use Py3DEP using command-line or as a Python library. The command-line interface provides access to two functionality:
Getting topographic data: You must create a geopandas.GeoDataFrame that contains the geometries of the target locations. This dataframe must have at least three columns: id, res, and geometry. The id column is used as filenames for saving the obtained topographic data to a NetCDF (.nc) file. The res column must be the target resolution in meter. Then, you must save the dataframe to a file with extensions such as .shp or .gpkg (whatever that geopandas.read_file can read).
Getting elevation: You must create a pandas.DataFrame that contains coordinates of the target locations. This dataframe must have at least two columns: x and y. The elevations are obtained using airmap service in meters. The data are saved as a csv file with the same filename as the input file with an _elevation appended, e.g., coords_elevation.csv.
$ py3dep --help
Usage: py3dep [OPTIONS] COMMAND [ARGS]...

Command-line interface for Py3DEP.

Options:
-h, --help  Show this message and exit.

Commands:
coords    Retrieve topographic data for a list of coordinates.
geometry  Retrieve topographic data within geometries.
The coords sub-command is as follows:
$ py3dep coords -h
Usage: py3dep coords [OPTIONS] FPATH

Retrieve topographic data for a list of coordinates.

FPATH: Path to a csv file with two columns named ``lon`` and ``lat``.

Examples:
    $ cat coords.csv
    lon,lat
    -122.2493328,37.8122894
    $ py3dep coords coords.csv -q airmap -s topo_dir

Options:
-q, --query_source [airmap|tnm|tep]
                                Source of the elevation data.
-s, --save_dir PATH             Path to a directory to save the requested
                                files. Extension for the outputs is either
                                `.nc` for geometry or `.csv` for coords.

-h, --help                      Show this message and exit.
And, the geometry sub-command is as follows:
$ py3dep geometry -h
Usage: py3dep geometry [OPTIONS] FPATH

Retrieve topographic data within geometries.

FPATH: Path to a shapefile (.shp) or geopackage (.gpkg) file.
This file must have three columns and contain a ``crs`` attribute:
    - ``id``: Feature identifiers that py3dep uses as the output netcdf/csv filenames.
    - ``res``: Target resolution in meters.
    - ``geometry``: A Polygon or MultiPloygon.

Examples:
    $ py3dep geometry ny_geom.gpkg -l "Slope Map" -l DEM -s topo_dir

Options:
-l, --layers [DEM|Hillshade Gray|Aspect Degrees|Aspect Map|GreyHillshade_elevationFill|Hillshade Multidirectional|Slope Map|Slope Degrees|Hillshade Elevation Tinted|Height Ellipsoidal|Contour 25|Contour Smoothed 25]
                                Target topographic data layers
-s, --save_dir PATH             Path to a directory to save the requested
                                files.Extension for the outputs is either
                                `.nc` for geometry or `.csv` for coords.

-h, --help                      Show this message and exit.
Now, let’s see how we can use Py3DEP as a library.
Py3DEP accepts Shapely’s Polygon or a bounding box (a tuple of length four) as an input geometry. We can use PyNHD to get a watershed’s geometry, then use it to get the DEM and slope in meters/meters from Py3DEP using get_map function.
The get_map has a resolution argument that sets the target resolution in meters. Note that the highest available resolution throughout the CONUS is about 10 m, though higher resolutions are available in limited parts of the US. Note that the input geometry can be in any valid spatial reference (geo_crs argument). The crs argument, however, is limited to CRS:84, EPSG:4326, and EPSG:3857 since 3DEP only supports these spatial references.
import py3dep
from pynhd import NLDI

geom = NLDI().get_basins("01031500").geometry[0]
dem = py3dep.get_map("DEM", geom, resolution=30, geo_crs=4326, crs=3857)
slope = py3dep.get_map("Slope Degrees", geom, resolution=30)
slope = py3dep.deg2mpm(slope)
We can also use static_dem function to get the same DEM:
import xrspatial

dem = py3dep.get_dem(geom, 30)
slope = xrspatial.slope(dem.rio.reproject(5070))
slope = py3dep.deg2mpm(slope)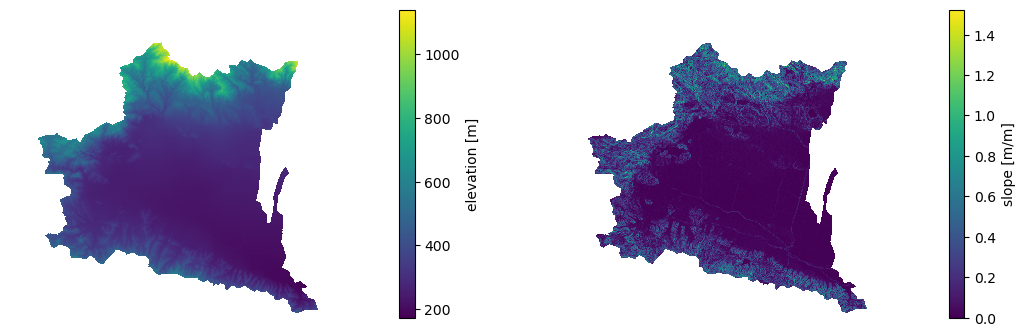
We can use rioxarray package to save the obtained dataset as a raster file:
import rioxarray

dem.rio.to_raster("dem_01031500.tif")
Moreover, we can get the elevations of a set of x- and y- coordinates on a grid. For example, let’s get the minimum temperature data within this watershed from Daymet using PyDaymet then add the elevation as a new variable to the dataset:
import pydaymet as daymet
import xarray as xr
import numpy as np

clm = daymet.get_bygeom(geometry, ("2005-01-01", "2005-01-31"), variables="tmin")
elev = py3dep.elevation_bygrid(clm.x.values, clm.y.values, clm.crs, clm.res[0] * 1000)
attrs = clm.attrs
clm = xr.merge([clm, elev])
clm["elevation"] = clm.elevation.where(~np.isnan(clm.isel(time=0).tmin), drop=True)
clm.attrs.update(attrs)
Now, let’s get street network data using osmnx package and add elevation data for its nodes using elevation_bycoords function.
import osmnx as ox

G = ox.graph_from_place("Piedmont, California, USA", network_type="drive")
x, y = nx.get_node_attributes(G, "x").values(), nx.get_node_attributes(G, "y").values()
elevation = py3dep.elevation_bycoords(zip(x, y), crs=4326)
nx.set_node_attributes(G, dict(zip(G.nodes(), elevation)), "elevation")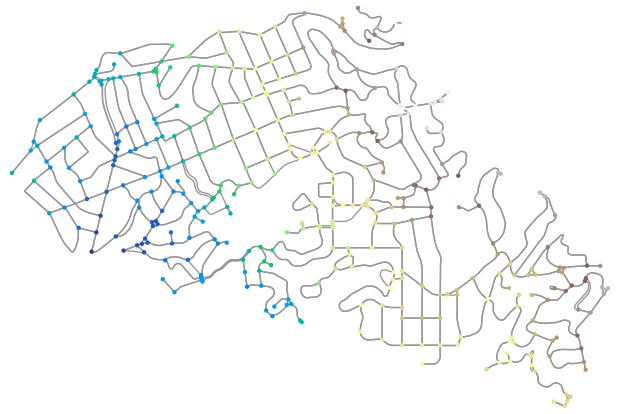
We can get the elevation profile along a line at a given spacing using elevation_profile function. For example, let’s get the elevation profile at 10-m spacing along the main flowline of the upstream drainage area of a USGS station with ID 01031500:
import py3dep
from pynhd import NLDI

flw_main = NLDI().navigate_byid(
    fsource="nwissite",
    fid="USGS-01031500",
    navigation="upstreamMain",
    source="flowlines",
    distance=1000,
)
line = flw_main.geometry.unary_union
elevation = py3dep.elevation_profile(line, 10)
Contributing
Contributions are very welcomed. Please read CONTRIBUTING.rst file for instructions.
Release history Release notifications | RSS feed


Download files
Download the file for your platform. If you're not sure which to choose, learn more about installing packages.


