The pyMEAN package is designed to facilitate semi-automated enrichment analysis for metabolomic experiments.

Project description
pyMEAN: Metabolomic Enrichment ANalysis in Python
The pyMEAN package is designed to facilitate semi-automated enrichment analysis for metabolomic experiments.
Installation
pyMEAN requires Python 3+ and is unfortunately not compatible with Python 2. If you are still using Python 2, a clever workaround is to install Python 3 and use that instead.
The easiest way of installing pyMEAN is using pip:
pip install pymean
Alternatively, you can use git and pip in unison to get the development branch:
pip install https://github.com/KeironO/pyMEAN
Usage
Here's a starting template to get you started:
# Import pyMEAN module into Python.
from pymean import EnrichmentAnalysis

# A compound list of inchikeys.
compound_list = [
    "WDJHALXBUFZDSR-UHFFFAOYSA-N", # acetoacetic acid
    "UCMIRNVEIXFBKS-UHFFFAOYSA-N", # beta-alanine
    "CVSVTCORWBXHQV-UHFFFAOYSA-N", # creatine
    "FFDGPVCHZBVARC-UHFFFAOYSA-N", # dimethylglycine
    "VZCYOOQTPOCHFL-OWOJBTEDSA-N", # fumaric acid
    "DHMQDGOQFOQNFH-UHFFFAOYSA-N", # glycine
    "FFFHZYDWPBMWHY-UHFFFAOYSA-N", # l-homocysteine
    "XUJNEKJLAYXESH-REOHCLBHSA-N", # l-cysteine
    "COLNVLDHVKWLRT-QMMMGPOBSA-N", # l-phenylalanine
    "BTNMPGBKDVTSJY-UHFFFAOYSA-N" # phenylpyruvic acid
]


# Create an EnrichmentAnalysis object for the analysis of hsa
ea = EnrichmentAnalysis(compound_list, organism="hsa")

# Run the analysis
ea.run_analysis(pvalue_cutoff=0.05)

# Obtain results (in the format of a pandas dataframe)
resuklts = ea.results
If you'd like to plot out your results, take inspiration from the following method:
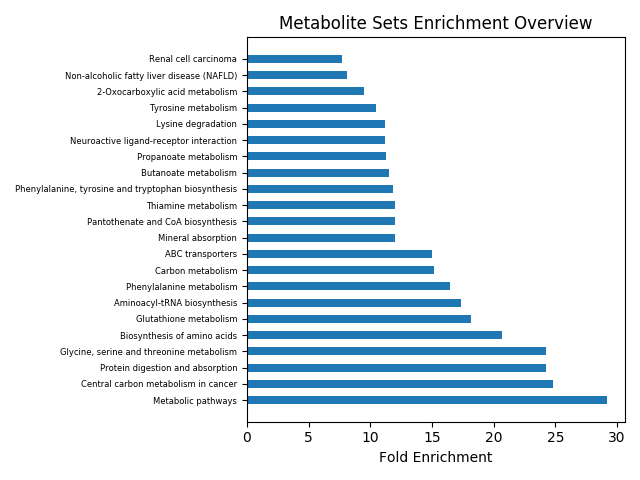
def plot_enrichment_analysis_results(results: pd.DataFrame, adj_method:str):
    fold_enrichment = np.abs(np.log(results["%s adj. p-value" % (adj_method)]))
    plt.figure()
    plt.title("Metabolite Sets Enrichment Overview")
    plt.barh(results["Pathway Name"], fold_enrichment, height=0.5)
    plt.xlabel("Fold Enrichment")

    plt.yticks(fontsize=6)
    plt.tight_layout()

    plt.show()

plot_enrichment_analysis_results(results, "fdr_bh")
Which will return the following chart:
License
Code released under the GPLv3.


Download files
Download the file for your platform. If you're not sure which to choose, learn more about installing packages.


