SVG Hiveplot Python API
Project description
Pyveplot
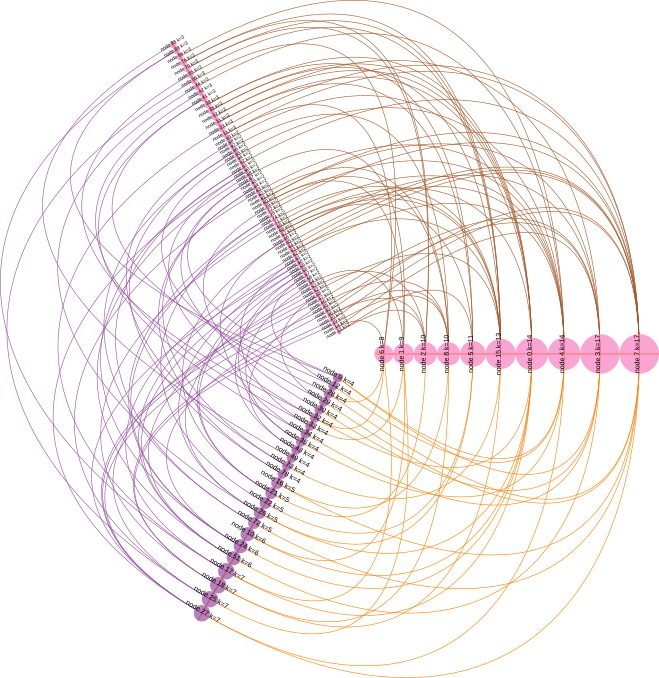
A nice way of visualizing complex networks are Hiveplots.
This library uses svgwrite to programmatically create images like the one bellow, a visualization of a Barabasi-Albert network, in which nodes are categorized by degree into high, medium and low.
Here's the code that generated the figure:
    from pyveplot import Hiveplot, Axis, Node
    import networkx as nx
    import random

    c = ['#e41a1c', '#377eb8', '#4daf4a',
         '#984ea3', '#ff7f00', '#ffff33',
         '#a65628', '#f781bf', '#999999',]

    # create hiveplot object
    h = Hiveplot()

    # create three axes, spaced at 120 degrees from each other
    h.axes = [Axis(start=20, angle=0,
                   stroke=random.choice(c), stroke_width=1.1),
              Axis(start=20, angle=120,
                   stroke=random.choice(c), stroke_width=1.1),
              Axis(start=20, angle=120 + 120,
                   stroke=random.choice(c), stroke_width=1.1)
              ]

    # create a random Barabasi-Albert network
    g = nx.barabasi_albert_graph(100, 2)

    # sort nodes by degree
    k = list(nx.degree(g))
    k.sort(key=lambda tup: tup[1])

    # categorize them as high, medium and low degree
    hi_deg = [v[0] for v in k if v[1] > 7]
    md_deg = [v[0] for v in k if v[1] > 3 and v[1] <= 7]
    lo_deg = [v[0] for v in k if v[1] <= 3]

    # place these nodes into our three axes
    for axis, nodes in zip(h.axes,
                           [hi_deg, md_deg, lo_deg]):
        circle_color = random.choice(c)
        for v in nodes:
            # create node object
            node = Node(radius=g.degree(v),
                        label="node %s k=%s" % (v, g.degree(v)))
            # add it to axis
            axis.add_node(v, node)
            # once it has x, y coordinates, add a circle
            node.add_circle(fill=circle_color, stroke=circle_color,
                            stroke_width=0.1, fill_opacity=0.7)
            if axis.angle < 180:
                orientation = -1
                scale = 0.6
            else:
                orientation = 1
                scale = 0.35
            # also add a label
            node.add_label("node %s k=%s" % (v, g.degree(v)),
                           angle=axis.angle + 90 * orientation,
                           scale=scale)

    # iterate through axes, from left to right
    for n in range(-1, len(h.axes) - 1):
        curve_color = random.choice(c)
        # draw curves between nodes connected by edges in network
        h.connect_axes(h.axes[n],
                       h.axes[n+1],
                       g.edges,
                       stroke_width=0.5,
                       stroke=curve_color)

    # save output
    h.save('ba_hiveplot.svg')
Installation
Install library::
$ pip install pyveplot


