Format Matplotlib scientific plots

Project description
Sciplot


Format Matplotlib scientific plots
Sciplot is a Python package that formats scientific plots created with Matplotlib in a user-friendly, yet highly customizable way. It makes typesetting in LaTeX possible and comes with several methods that makes plotting more straightforward and less cluttered, without sacrificing full control over plot settings.
Two examples of plots created with Sciplot:
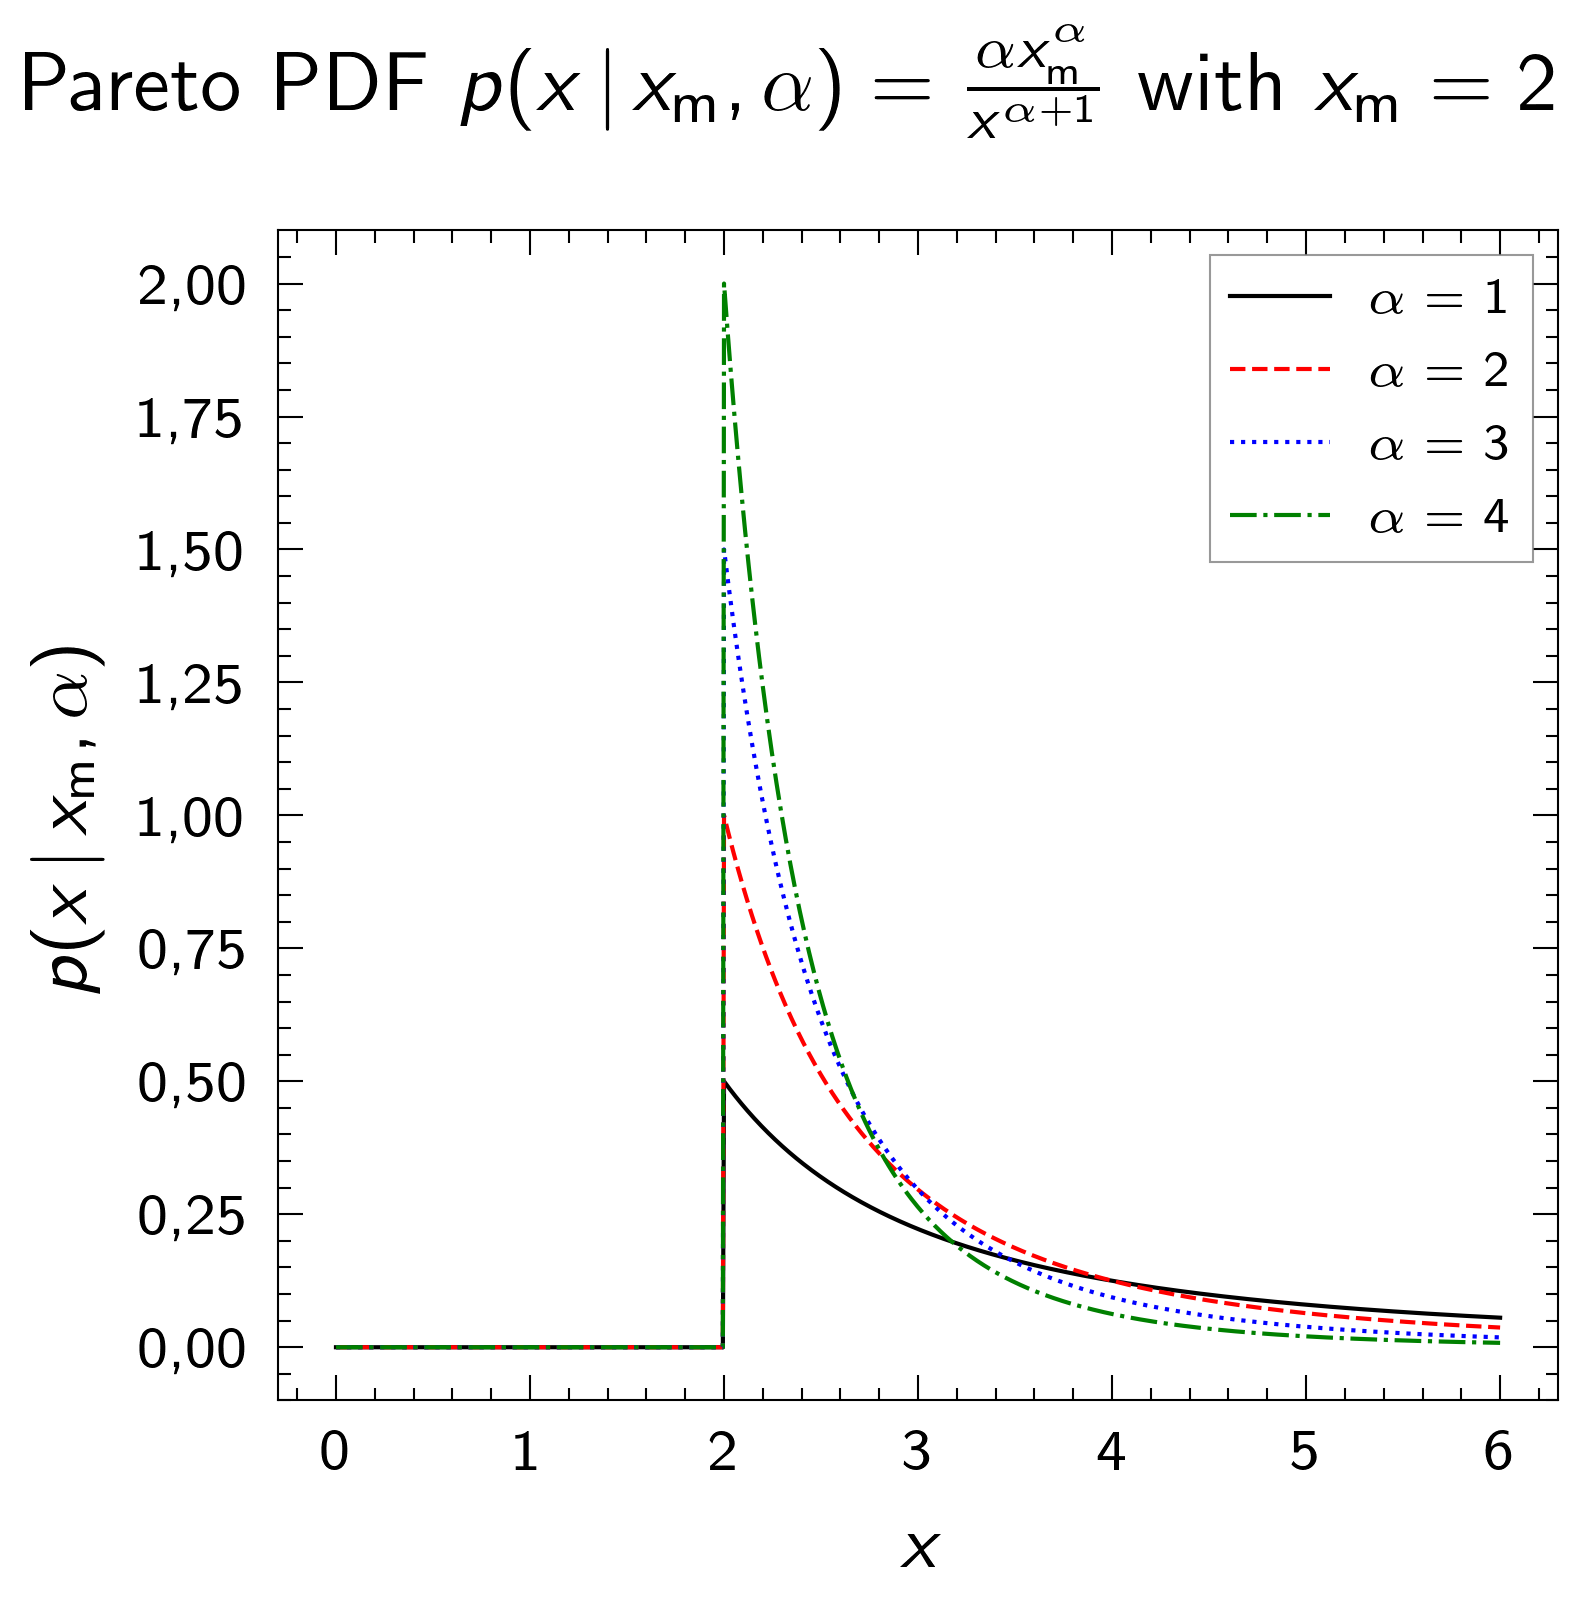
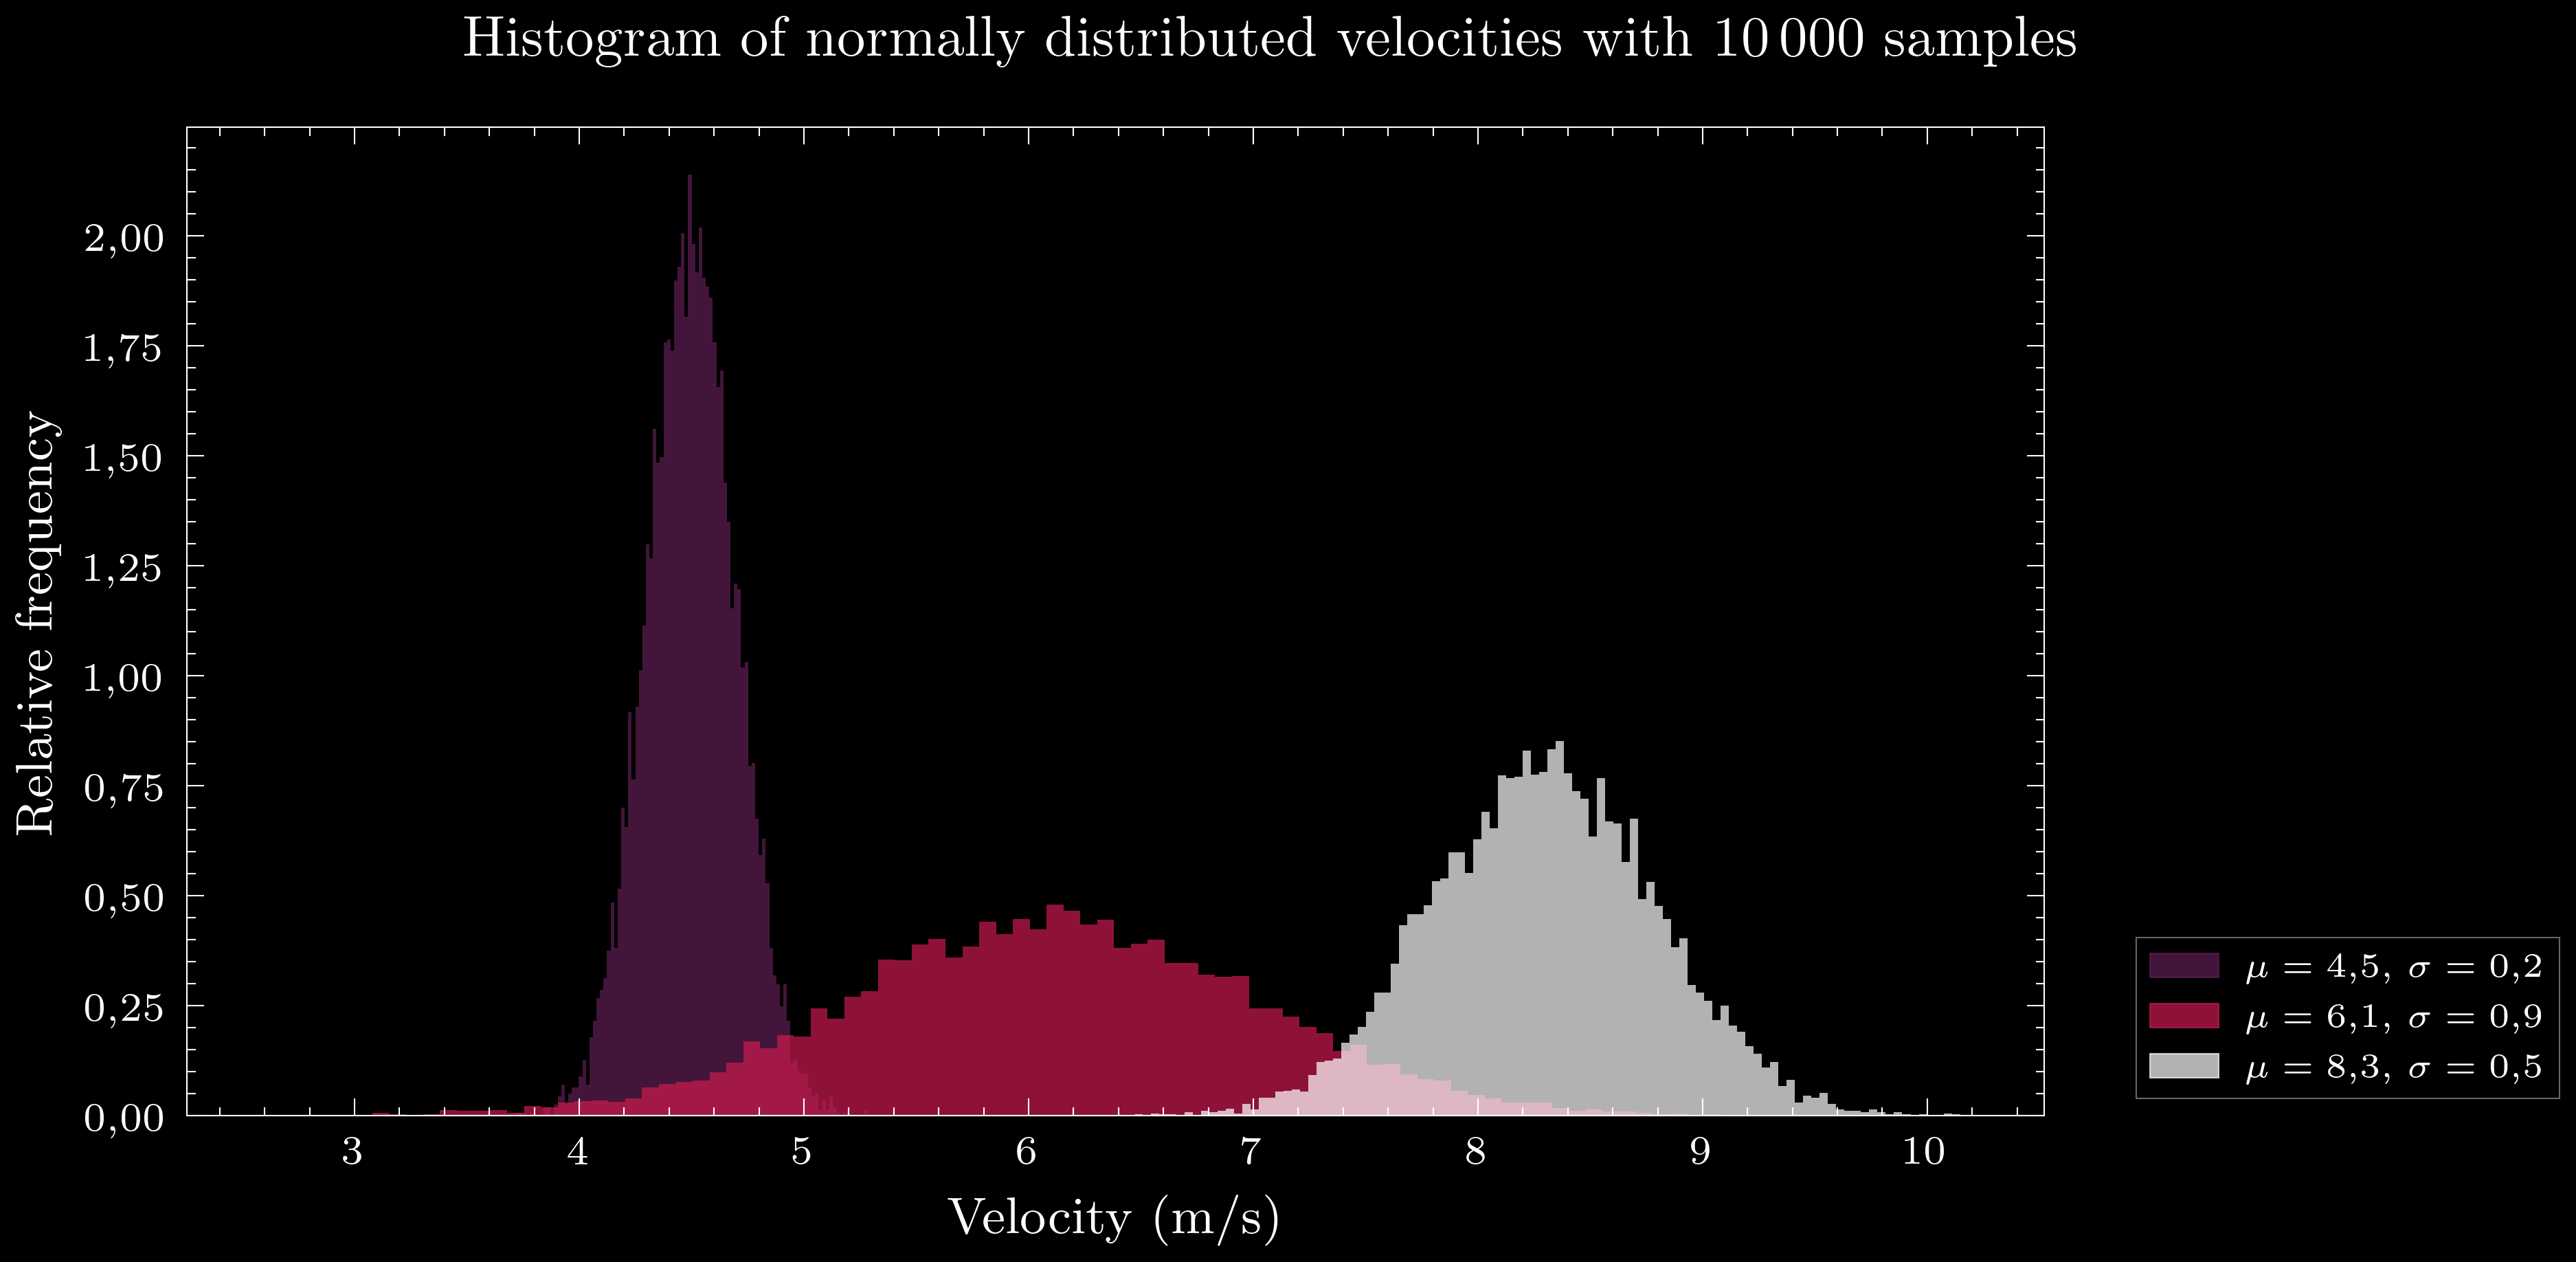
The Sciplot package was developed by Andreas Führ in May 2021.
Installation and getting started
To install the latest release from PyPI, use the following command:
pip install sciplot
To install the latest commit, please use:
pip install git+https://github.com/andreasfuhr/sciplot.git
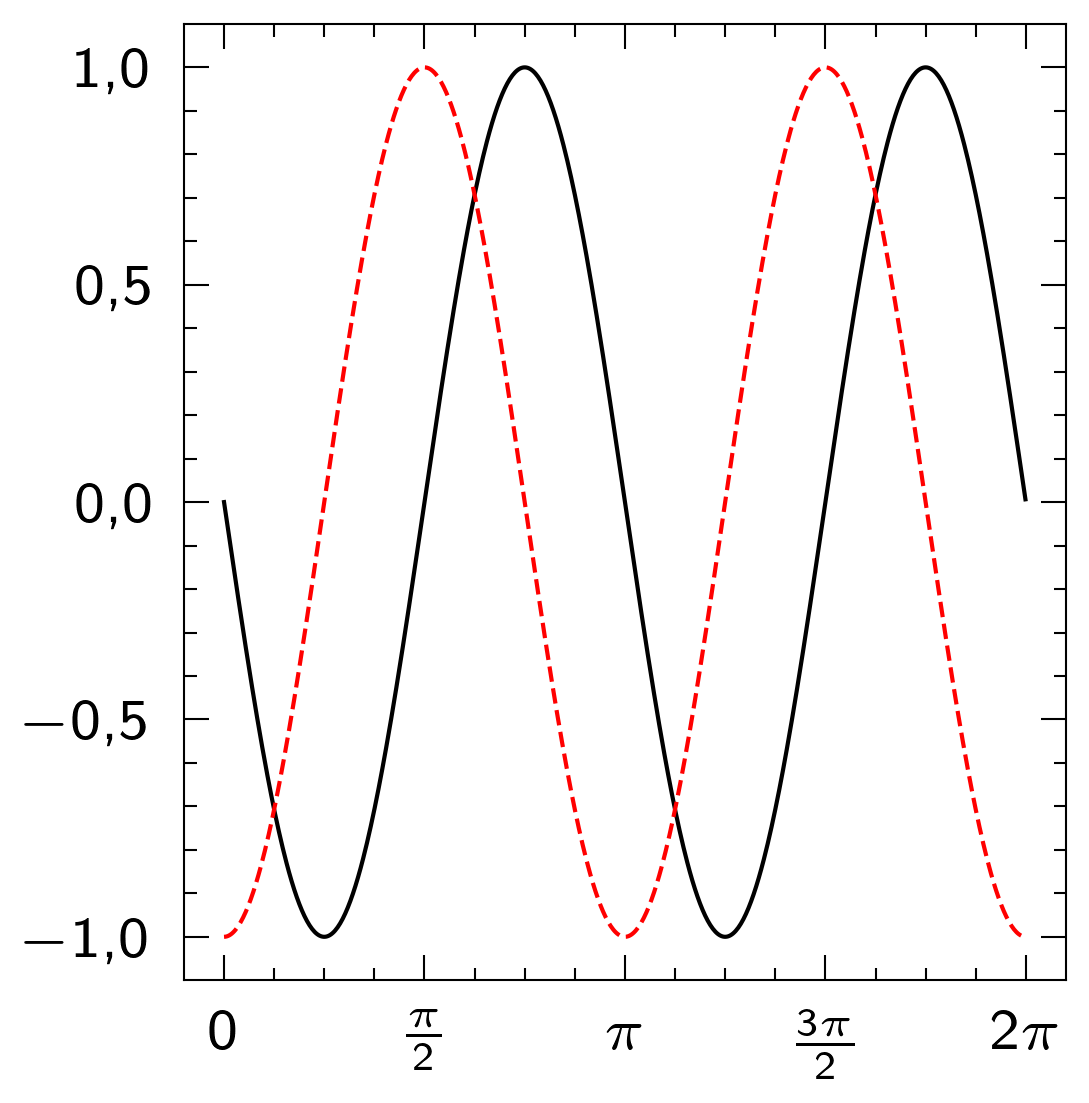
Formatting plots in Matplotlib is based on a functional with-statement context. A MWE can be demonstrated as follows:
import matplotlib.pyplot as plt
import numpy as np
import sciplot

x = np.arange(0, 2 * np.pi, 1e-2)
y1 = np.sin(2 * x + np.pi)
y2 = np.cos(2 * x + np.pi)

sciplot.set_size_cm(5)  # Alternatively, set figure size with Matplotlib directly

with sciplot.style():
    plt.plot(x, y1, x, y2)
    plt.xticks(
        np.linspace(0, 2 * np.pi, 5),
        ['$0$', r'$\frac{\pi}{2}$', r'$\pi$', r'$\frac{3\pi}{2}$', r'$2\pi$']
    )
    plt.show()
This produces the following output:
Overview
Key Features:
- User-friendly. A style context manager is used for all Matplotlib related user code and can be passed several
themes and arguments to alter the look of the plot, such as:
- LaTeX typesetting
- serif or sans serif font
- dark mode
- locale string (for correct decimal separator etc.)
- Implements LaTeX kernel for typesetting plots. A versatile LaTeX preamble is included that is specifically created and optionally editable for mathematics- and physics-oriented papers, theses and presentations. Both the siunitx and physics LaTeX packages are included by default in the parameter settings.
- Easy customization. Most settings have been moved to parameters files, which are imported to the context manager and
configured with
matplotlibrc. The user is encouraged to edit these accessible and highly readable YAML parameters files, or create new theme-associated parameter files, whom are found with thesciplot.get_paramters_dir()method. - Includes a set of useful methods relevant during plotting:
sciplot.set_size_cm()for setting figure sizes in centimeterssciplot.set_legend()for customizing the content and position of plot legendssciplot.get_color_lst()for extracting a list of colors of specified length and from a given Seaborn colormapsciplot.save_time_stamped_figurefor saving plots in an easy manner with time stamped file names
Disadvantages:
- Slow. LaTeX typesetting, turned on by default, can take quite some time to compile. Loading the parameters is however not known from experience to be time consuming.
- Only compatible with Python 3.7 and later. The 3.3.4 version of Matplotlib fixes several bugs that directly solves some earlier issues with this package.
It should be noted that although this package is in many ways similar to [1], which is a recommended alternative approach, Sciplot has been independently developed and has a multitude of structural and functional differences.
How to use Sciplot
The style context and themes
The sciplot.style() context manager is the core feature of Sciplot. It is a powerful and versetile tool for a
complete control of the looks of plots created with Matplotlib. The context manager operates with two input arguments:
theme and locale_setting. By default, creating plots within the style context
with sciplot.style():
    ...
is equivalent to the following style context:
with sciplot.style(theme='default', locale_setting='sv_SE.UTF-8'):
    ...
Themes
A handful of themes are bundled with Sciplot. The theme argument can be passed either a single theme as a string or
a list of theme strings. Since all themes are not mutually exclusive w.r.t. Matplotlib settings, the themes are
segmented such that Sciplot distinguishes which style settings are more important and becomes prioritized (higher
number means lower priority):
| Priority | Theme | Description |
|---|---|---|
| 0 | Custom theme | A theme entirely made by the user. This is done by creating a parameter file in the sciplot.parameter directory. A theme named my_fabulous_theme will for example extract parameter settings from a file named my_fabulous_theme.yml. |
| 1 | alpha | Predefined, contentless user theme. Intended for editing by user. |
| 2 | beta | Predefined, contentless user theme. Intended for editing by user. |
| 3 | gamma | Predefined, contentless user theme. Intended for editing by user. |
| 4 | no-latex | No local LaTeX kernel is used for typesetting. |
| 5 | serif | Computer Modern Roman used as text and math font, with typesetting in LaTeX. |
| 6 | sans-serif | Computer Modern Roman Sans Serif used as text and math font, with typesetting in LaTeX. |
| 7 | dark | Uses Matplotlib's dark_background style and comes with a set of colours suitable for plotting against a black background. |
| 8 | default | The default theme. Always active unless the clean "theme" is used. Uses LaTeX typesetting and Computer Modern Roman Sans Serif as text and math font. Initialises basic figure settings for linewidths, ticks, legends, font sizes, dpi, margins, etc. Also comes with the cubehelix colourmap [2] as well as basic plot colours and styles. |
| – | clean | Not technically a theme. Simpy inactivates the default theme. |
Locales
The locale_setting argument lets the user determine the locale to be used in a plot, thereby determining a set of
parameters that defines the user's language, region and other regionally based settings and whom are used by Matplotlib
to alter the appearance of a plot. To see all available locales, one can call the sciplot.get_available_locals
method for a console printout.
Code example
If a plot style with dark theme, LaTeX, a serif font (Computer Modern Roman) and local settings for the United States is requested, the style context should be initiated with
with sciplot.style(['dark', 'serif'], 'en_US'):
    ...
Future improvements
The package is still in its infancy and is planned to be expanded in features and configurability. Here is a list of what is in the pipeline:
- Documentation of source code
- Instructions on how to install a local LaTeX distribution
- Making it possible to choose LaTeX fonts. As of currently, Computer Modern Roman and Computer Modern Roman Sans Serif are the only two font options for both text and mathematical notation.
- Include more example plots in documentation
- Write instructions on how to use the package
- Address potential issues with user defined themes and updating sciplot
- Move sciplot methods not used by the user outside of
sciplot.main
Table of proposed themes not yet implemented:
| Name of theme | Priority | Background color | Font | Seaborn colormap | Figure size |
|---|---|---|---|---|---|
| antique | low | white | Garamond | TBD | - |
| ieee_column | medium | white | ?1 | TBD | 88 mm2 |
| ieee_page | low | white | ?1 | TBD | 181 mm2 |
| grid | high |
1: One of the following Open Type fonts are suggested to be used: Times New Roman, Helvetica, Arial, Cambria or Symbol [3].
2: See [3] for a description of sizes that graphics should be.
Citing Sciplot
To cite this Python package, please use the following BibTeX citation:
@article{Sciplot,
  author       = {Andreas H. Führ},
  title        = {{andreasfuhr/sciplot}},
  month        = May,
  year         = 2021,
  version      = {0.8.1},
  url          = {https://github.com/andreasfuhr/sciplot}
}
Note that under the current license, citing this package is not necessary. The creator will however be happy and thankful for any recognition.
References
[1] J.D. Garrett and H. Peng, garrettj403/SciencePlots, ver. 1.0.7. Zenodo, Feb. 2021. [Online]. doi: 10.5281/zenodo.4106649
[2] D.A. Green, "A colour scheme for the display of astronomical intensity images," in Bulletin of the Astronomical Society of India, vol. 39, pp. 289–295, 2011. [Online]. Available: arXiv:1108.5083.
[3] "Preparation of papers for IEEE Transactions and Journals (December 2013)," in IEEE Transactions on Consumer Electronics, vol. 63, no. 1, pp. c3-c3, February 2017, doi: 10.1109/TCE.2017.7932035
Release history Release notifications | RSS feed


Download files
Download the file for your platform. If you're not sure which to choose, learn more about installing packages.


