Backtesting and Simulation package for financial transactions and trading
Project description
trapeza - simulation and backtesting of financial transactions
About
trapeza is a library for simulation and backtesting of financial transactions and in particular of tradings strategies.
There is a number of great backtesting libraries available for Python, which facilitate fast and easy-to-write
backtesting.
On the other hand, trapeza focuses on:
Flexibility:
The trapeza interface is designed for flexibility and customization such that a fast variety of real-life situation can be modelled appropriately, e.g. custom fees for certain transaction types (for instance volume dependent fees).Simulation & Modelling:
At its core, trapeza implements a time-discrete (stack) automaton logic. Thereby, transactions can be modelled with processing times, which would also occur in real-life situations such as time needed to transmit messages via telecommunication networks. The elapsed time is controlled via setting an internal clock. Furthermore, the user can control how much previous (historic) price and market information is available to the user-defined trading strategy at each time step of simulation, i.e. when modelling path-dependent strategies. trapeza can handle multiple stocks and assets when defining a strategy.Stochastic Analysis:
trapeza's backtest engine does not only backtest on historic market data, but furthermore slices input data, such as price and volume market data, into many sub-samples to analyze the performance of trading strategies. This roughly emulates the logic of Monte Carlo simulations by emulating random sub-samples of historic market data, which is especially useful when analyzing path-dependent strategies.
Additionally, common metrics assume very basic distribution models (e.g. Gaussian normal distribution). Instead, custom and more suitable distributions can be applied for calculating metrics. Even tough trapeza provides some basic metrics, the main goal of trapeza is not to provide sophisticated metrics or indicators.Visualization:
Even though sophisticated visualizations of analysis results is not the main goal of trapeza, trapeza offers a very basic, browser-based visualization dashboard implemented via Python Dash and Plotly.
trapeza does not mainly focus on speed. Nevertheless, large parts of the library are transpiled to C/ C++ via Cython.
The name "trapeza" is derived from the tables, which were used by ancient greek moneychangers for their activities - one of the first records in history regarding banking and monetary activities.
Legal Disclaimer
trapeza is written for scientific, educational and research purpose only. The author of this software and accompanying materials makes no representation or warranties with respect to the accuracy, applicability, fitness, or completeness of the contents. Therefore, if you wish to apply this software or ideas contained in this software, you are taking full responsibility for your action. All opinions stated in this software should not be taken as financial advice. Neither as an investment recommendation. This software is provided "as is", use on your own risk and responsibility.
This software is licensed under MIT License.
Quickstart
trapeza is built upon three main concepts:
- Account: A account conceptually represents a bank account/ trading depot. Basic transactions like deposit, withdraw, sell or buy an asset are implemented on account level. Each account keeps a record of positions regarding assets, which are hold by the account owner (called account.depot in this context).
- Strategy: Users can define a custom trading strategy, which only have to follow the call signature strategy_func(accounts, price_data_point, reference_currency, volume_data_point, fxstrategy, **strategy_kwargs). This strategy function, and a list of accounts (strategy function may use multiple accounts in its function body) is then passed to a strategy object, which handles simulation execution and collecting simulation results.
- Engine: Multiple strategy functions can be passed to the engine object. The engine object slices market data (i.e. price and volume data) into random sub-samples in order to perform Monte-Carlo-like stochastic simulation. The engine object furthermore evaluates results with regard to user-defined metrics based on the simulation results for each of the supplied strategies. This way, different strategies can be benchmarked against the same market at once.
Account
from trapeza.account import FXAccount

# initialize an account with reference currency set to EUR
# if the user wants more performance at the cost of safety: parameter ignore_type_checking=True
acc = FXAccount('EUR')

# deposit 100 EUR and take a fee of 5 EUR
acc.deposit(100, 'EUR', 5)

# get current depot status, returns a dict
print(acc.depot)
# >>> {'EUR': 95}

# suppose we have to transfer 50 EUR to a friend's account and the transaction takes 5 time steps to be processed at our
# account and 10 time steps to arrive at our friend's account
acc.transfer(friend_account, 50, 'EUR', payer_processing_duration=5, payee_processing_duration=10)
# check depot status again
print(acc.depot)
# >>> {'EUR': 95}     transfer has not taken effect yet, we first have to proceed in time steps

# proceed one time step
acc.tick()
print(acc.depot)
# >>> {'EUR': 95}   transfer has not taken effect yet as it takes 5 time steps

# set internal clock to 5 (fast forward...)
acc.tick(5)
print(acc.depot)
# >>> {'EUR': 45}   transfer is processed on our account now
Strategy
import numpy as np
from pandas_datareader import data
from trapeza.strategy import FXStrategy

# define a custom trading strategy
def avg_strategy(accounts, price_data_point, reference_currency, volume_data_point, fxstrategy):
    # We sell if the average-10-days-line crosses the average-50-days-line from above and buy if it crosses from below

    # price_data_point and volume_data_point: dict, tuples(currency_1, currency_2) as dict key,
    #                                               list of floats representing exchange rates at distinct time steps
    #                                               (here 52 time steps: current time_step at index=-1, lookback data of
    #                                               51 time steps is prepended, see below for explanation) as dict value
    # reference_currency: str, reference currency in which to evaluate strategy, can be different then the reference
    #                     currency of accounts
    # accounts: list of accounts, which are passed to FXStrategy
    # fxstrategy: placeholder for FXStrategy, which calls itself, e.g. for adding trade signals to FXStrategy

    avg_10_today = np.sum(price_data_point['BTC', 'EUR'][-10:]) / 10
    avg_50_today = np.sum(price_data_point['BTC', 'EUR'][-50:]) / 50
    avg_10_yesterday = np.sum(price_data_point['BTC', 'EUR'][-11:-1]) / 10
    avg_50_yesterday = np.sum(price_data_point['BTC', 'EUR'][-51:-1]) / 50
    price_today = price_data['BTC', 'EUR'][-1]

    if avg_10_yesterday < avg_50_yesterday and avg_10_today > avg_50_today:
        accounts[0].buy(1, price_today, 'BTC', 'EUR')  # buy 10 units
        fxstrategy.add_signal(accounts[0], 'buy')   # add signal associated with account 0

    if avg_10_yesterday > avg_50_yesterday and avg_10_today < avg_50_today:
        accounts[0].sell(1, price_today, 'BTC', 'EUR') # sell 10 units
        fxstrategy.add_signal(accounts[0], 'sell')  # add signal associated with account 0

# first deposit some more cash to account
acc.deposit(1_000_000, 'EUR')
acc.deposit(2, 'BTC')

# initialize strategy object
# Parameter lookback controls how many previous time steps of market data (additional to current time step) is passed to
# our custom strategy function. For our strategy we need to calculate a 50-days average. Furthermore we have to calculate
# this value for one time step before we start analyzing our trading strategy (i.e. line crossing is detected by comparing
# avg-10 and avg-50 of the previous day and the current day). Therefore, the lookback is 50 (avg-50 calculation) + 1
# (calculation of avg-50 for previous day): lookback=51.
# if the user wants more performance at the cost of safety: parameter ignore_type_checking=True
strategy = FXStrategy('my_awesome_strategy', acc, avg_strategy, lookback=51)

# We pull currency data from yahoo finance. This is somehow a bit tedious
btc_eur = data.DataReader('BTC-EUR', start='2020-06-01', end='2021-05-12',
                          data_source='yahoo')['Close'].reset_index().drop_duplicates('Date', 'last')
eur_usd = data.DataReader('EURUSD=X', start='2020-06-01', end='2021-05-12',
                          data_source='yahoo')['Close'].reset_index().drop_duplicates('Date', 'last')
btc_usd = data.DataReader('BTC-USD', start='2020-06-01', end='2021-05-12',
                          data_source='yahoo')['Close'].reset_index().drop_duplicates('Date', 'last')
# EUR|BTC is only traded on work days as opposed to cryptocurrencies, which are traded 365 days a year
# so we need to restrict our data to work days only in order to be comparable
currency_dates = eur_usd['Date'].to_numpy()
crypto_dates = btc_eur['Date'].to_numpy()
common_dates = np.sort(np.array(list(set(currency_dates).intersection(set(crypto_dates))))) # filter out common days
btc_eur = btc_eur[btc_eur['Date'].isin(common_dates)]['Close'].to_numpy()
btc_usd = btc_usd[btc_usd['Date'].isin(common_dates)]['Close'].to_numpy()
eur_usd = eur_usd[eur_usd['Date'].isin(common_dates)]['Close'].to_numpy()
# finally we can build our input data
price_data = {('BTC', 'EUR'): btc_eur, ('EUR', 'USD'): eur_usd, ('BTC', 'USD'): btc_usd}

# run backtest and evaluate our strategy in USD, even though our account is referenced and billed in EUR
# conversion from BTC and EUR (which are hold in account's depot) is done automatically
strategy.run(price_data, 'USD')

# results can be accessed via attributes
print(strategy.merged_total_balances)   # returns total value over all accounts (in our case one account) given in USD
# >>> [1196651.6894629002, 1196876.5245821476, 1203001.5259501934, ... , 1313077.8513996354]
print(len(price_data['BTC', 'EUR']), len(strategy.merged_total_balances))
# >>> 245 194   strategy runs over 194 time steps, we supplied 245 time steps of market data (of which 51 are used as
#               lookback data for calculating our trading decisions)
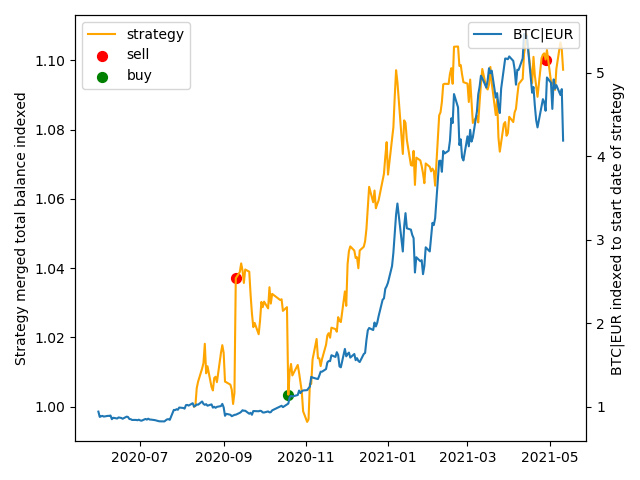
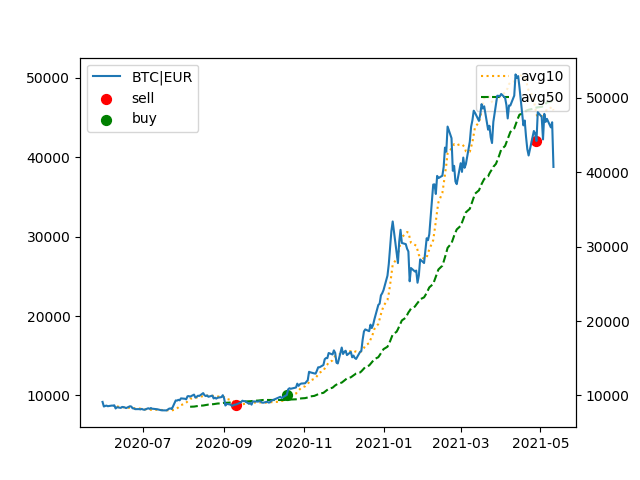
Results can be visualized with any Python library of choice (here: matplotlib). Notice, that strategy execution starts
at time step 51 (which elucidates the concept of lookback data):
(BTC|EUR price and total value of trading strategy/ performance at each time step, both indexed to 1 at start time of
strategy execution at time step 51)
(BTC|EUR price, avg10 and avg50 indicators at each time step)
As we can see from the plots, this strategy doesn't seem to outperform a basic buy-and-hold-strategy by much for the chosen time frame (which makes sense regarding the bullish trend within the market data).
Engine
from trapeza.engine import FXEngine
from trapeza.dashboard import FXDashboard

# initialize engine
# if the user wants more performance at the cost of safety: parameter ignore_type_checking=True
engine = FXEngine('backtesting', strategy, n_jobs=-1)  # n_jobs: use all available cores

# Run stochastic backtesting wherein the length of a randomly drawn sub-sample is at least 5 time steps and at most
# 50 time steps. All possible sub-samples, which comply to this condition, will be drawn. Alternatively, the max number
# of draws can be defined via max_total_runs parameter. In this case we only draw 200 sub-samples.
engine.run(price_data, 'USD', min_run_length=5, max_run_length=50, max_total_runs=200)

# We now can analyze results. FXEngine has a set of standard metrics, but users can pass custom metrics as well.
def custom_metric(x):
    return np.var(x)
engine.analyze({'my_metric': custom_metric})

# Results are stored in self.standard_analysis_results for the standard metrics implemented in FXEngine, and in
# self.analysis_results for custom metrics
print(engine.standard_analysis_results)
# metrics are evaluated for each strategy and for each sub-sample, which is defined by the window length (here between 5
# and 50) and by its start time step (index in time series data)
# >>> {'my_awesome_strategy':
#       {('10', '138'):
#           {'total_rate_of_return': -0.3178841284640982, 'volatility': 0.05711533033257823,
#            'expected_rate_of_return': -0.001678860489711134, 'expected_rate_of_log_return': -0.0016867536858783518,
#            'sharpe_ratio': -7.924901653751582, 'sortino_ratio': -8.217863784511843, 'value_at_risk': -0.09134675866458732,
#            'max_drawdown': 19997.846368551254
#           },
#        ('10', '140'):
#           {'total_rate_of_return': -0.009707405842422023, ...
#           },
#        ...
#        }
#     }
print(engine.analysis_results)
# >>> {'my_awesome_strategy':
#       {('10', '138'):
#           {'my_metric': 46553148.03839398
#           },
#        ('10', '140'):
#           {'my_metric': 30596348.629725147
#           },
#        ...
#       }
#     }

# Furthermore, a simple dashboard visualization is provided by trapeza
dash = FXDashboard(engine)
dash.run(debug=False)   # dashboard can be opened in browser with local address
# >>> Dash is running on http://127.0.0.1:8050/
#     * Serving Flask app "script_doc_examples" (lazy loading)
#     * Environment: production
#       WARNING: This is a development server. Do not use it in a production deployment.
#       Use a production WSGI server instead.
#     * Debug mode: off

# DO NOT FORGET TO CLOSE: this deletes all temporary cached files (even though this should also work without calling
# self.close() explicitly - but safe is safe)
engine.close()
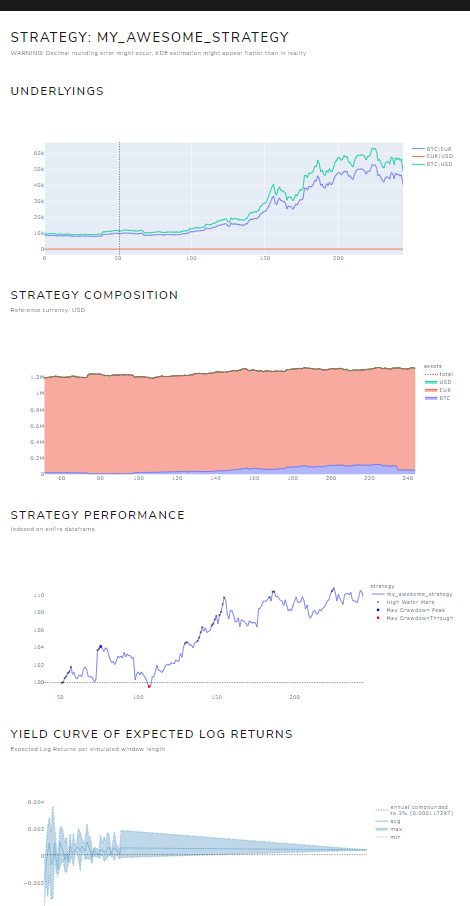
Even though trapeza does not focus on visualization, this library still provides a very basic dashboard:
Nonetheless, there are certainly better libraries for visualization then the one provided by trapeza.
All the above example code located at: doc/script_readme_examples.py.
More examples at: docs/examples.md (e.g. RSI-based trading strategy).
Custom Implementations
FXAccount, FXStrategy, FXEngine and FXDashboard all inherit from respective base classes (i.e. BaseAccount, BaseStrategy,
BaseEngine, BaseDashboard). Own implementations can be written as drop-in replacement.
If those implementations shall be compatible in their use with existing classes, then they also have to inherit from
those base classes.
The FX-implementations are all focused on (infinitely) divisible (often intangible) assets, such as currencies. Those
implementations can also be easily adapted for the use with e.g. stocks if rounding of volumes at FXAccount.buy() and
FXAccount.sell() is done appropriately to the next integral number.
Quick Install
Pip install
Installation is as easy as:
pip install trapeza
This should work for Windows, Linux and MacOS.
Tested under Windows10/ Python3.6.7 and Ubuntu-20.04.2/ Python3.8.5.
Not tested under MacOS yet.
Build from Source
trapeza can also be re-compiled and built from source, see the documentation regarding installation.
This is useful for development purpose or if the user has complications with mpdecimal (external C-library used for
decimal math) and wants to re-compile mpdecimal separately, which also induces a re-compilation of trapeza.
Make sure to pip install -e . after re-compiling.
Requirements
Requirements for trapeza (installs automatically if not already satisfied):
numpy
pandas
scipy
joblib
scikit-learn
dash
plotly
matplotlib
flask
setuptools
pathlib; python_version < "3.4"
Documentation
- Table of Content
- Installation
- Main Concepts
- Arithmetics (Context Settings)
- Exceptions
- Examples
- Development Notes
- API Reference
Source Code
Source code and documentation can be found at: https://gitlab.com/LHuebser/trapeza
Development Roadmap
trapeza is under active development and released as beta.
Contribution and suggestions for improvements and future features are warmly welcome!
See Development Notes.
Current Status
- trapeza is currently in its beta version. All provided classes, methods and functions are fully functional and extensively tested.
- So far, the implementations FXAccount, FXStrategy and FXEngine are conceptually tailored for monetary exchange transactions - or more generally speaking for continuously divisible assets. Nonetheless, if rounding to integral numbers is applied to trade volumes, then those concepts are also applicable for stocks (i.e. base=stock, quote=currency).
- Current FXDashboard implementation has only very basic and limited visualization capabilities and only makes sense to use in conjunction with classes, that implement Monte-Carlo-alike backtesting (e.g. FXEngine). Therefore, visualization in FXDashboard focuses on representing distributions of metrics over multiple backtesting runs with randomly sub-sampled data.
- FXEngine limits the types of metrics, which can be evaluated. Only metrics, that output a single value given a time series of a strategy's total value (calculated in a given reference currency) per time step are compatible with FXEngine.
- Metrics provided in trapeza.metrics are not checked in a scientific manner and are not compared to the latest research or to the up-to-date state-of-the-art. Metrics implemented in this software do not state financial advice or investment recommendations, nor do they make any representation or warranties with respect to the accuracy, applicability, fitness, or completeness of the contents. Therefore, if you wish to apply this metrics or ideas contained in this software, you are taking full responsibility for your action.
To-Dos
- Sometimes FXEngine does not use all cores, even if it is specified by method arguments. This is due to some unknown behavior of joblib (possibly interacting with BLAS of numpy), which is used for multi-processing in trapeza. This needs further investigation but does not limit the general capability of trapeza.
- emin and emax in libmpdec (wrapper for mpdecimal C-library) are currently left at default (this should work without any troubles), customization would be good.
- extend examples, e.g. risk models (i.e. via sklearn), usage of other financial Python packages in conjunction with trapeza, etc.
- Implement win-loss metric in trapeza.metrics.
- Add an example where price data is generated dynamically inside the strategy decision function, e.g. when modelling option or turbo bull prices (which change depending on the underyling) such that those prices do not have to be passed within the price_data_dict argument supplied to FXStrategy.run() but are generated dynamically inside the strategy decision function.
- Add benchmarks for testing the accuracy of the implemented metrics in comparison to other Python packages.
- Add benchmarks regarding backtesting strategies (compute time and accuracy) in comparison to other Python packages.
Full To-Do list
Future Development
- Add further FX market specific mechanisms, e.g. roll-overs and margin trading (or dividends and ex-dividend prices when handling stocks).
- Improve visualization in FXEngine.
- Implementation and integration of fixed point arithmetics as alternative to 'FLOAT', 'DECIMAL',
'LIBMPDEC_FAST' (uses ryu dtoa), 'LIBMPDEC' (uses dtoa of CPython) when setting trapeza.context.ARITHMETICS
See todo in trapeza.arithmetics for adding rounding methods when implementing fixed point arithmetics.
--> Currently, there is no urgent need for this as fixed point math can be emulated via trapeza.context.ARBITRARY_QUANTIZE_SIZE setting. Only reason for implementing fixed point math separately would be runtime performance... - Implement more order types (Order Management).
- Implement more metrics: tail value at risk, bias ratio, win-loss-ratio, average absolute deviation, calmar ratio, long short exposure, sector exposure, etc. and more probability models (e.g. chebyshev) for calculating metrics.
- Implement a delay element at order management between hitting limit price and actual order execution (price), e.g. there's a difference between stop loss and stop loss limit, which are currently the same.
- Improve computation time of FXEngine.analyze().
- Implement some kind of liquidity simulation, which makes backtesting more realistic especially for larger trading volumes.
License
MIT License
Copyright (c) 2021 Louis Huebser
Permission is hereby granted, free of charge, to any person obtaining a copy of this software and associated documentation files (the "Software"), to deal in the Software without restriction, including without limitation the rights to use, copy, modify, merge, publish, distribute, sublicense, and/or sell copies of the Software, and to permit persons to whom the Software is furnished to do so, subject to the following conditions:
The above copyright notice and this permission notice shall be included in all copies or substantial portions of the Software.
THE SOFTWARE IS PROVIDED "AS IS", WITHOUT WARRANTY OF ANY KIND, EXPRESS OR IMPLIED, INCLUDING BUT NOT LIMITED TO THE WARRANTIES OF MERCHANTABILITY, FITNESS FOR A PARTICULAR PURPOSE AND NONINFRINGEMENT. IN NO EVENT SHALL THE AUTHORS OR COPYRIGHT HOLDERS BE LIABLE FOR ANY CLAIM, DAMAGES OR OTHER LIABILITY, WHETHER IN AN ACTION OF CONTRACT, TORT OR OTHERWISE, ARISING FROM, OUT OF OR IN CONNECTION WITH THE SOFTWARE OR THE USE OR OTHER DEALINGS IN THE SOFTWARE.
Project details
Release history Release notifications | RSS feed
Download files
Download the file for your platform. If you're not sure which to choose, learn more about installing packages.
Source Distribution
Built Distribution
Hashes for trapeza-0.0.11-cp37-cp37m-win_amd64.whl
| Algorithm | Hash digest | |
|---|---|---|
| SHA256 | 072c43403d7120b79b08a803c667fa661706484543fa3125a8812ca363187031 |
|
| MD5 | c3bfcd13c3952206aad3355471e639e0 |
|
| BLAKE2b-256 | 8fccae89a881d1318f7dee496bbc01c2420a3fb5b83358c25199e3412474da13 |


