Distance between trajectories


Project description


Introduction
In this package three landmark-based distances and their feature mappings, introduced in [1], [2], are implemented (for more details see Overview section). Moreover, it provides access to fundamental functions used in calculating these distances.
Overview
More details for understanding the functionality of the package:
1. Feature mapping used in calculating d_Q
First, using a landmark set Q, an orientation-non-perserving (unsigned version) feature mapping, taken from [1], is provided to convert a trajectory to a vector of length |Q|.
Second, using a landmark set Q and a positive parameter sigma, an orientation-perserving (signed version) feature mapping, taken from [2], is provided to convert a trajectory to a vector of length |Q| that cares about the direction of curves.
In this package these functionalities can be accessed by the implemented curve2vec function.
2. d_Q distance of two trajecetories
The d_Q distance of two trajectories is the normalized Euclidean distance between two vectorized trajectories via above feature mappings.
In this package this functionality is given by d_Q function.
3. d_Q_pi distance of two trajectories
This is the normalized l^p-distance of the associated argmin points on trajectories obtained by landmarks Q.
In this package this is provided by d_Q_pi function.
4. Visualizations
4.1. Drawing landmarks and trajectories
Visaulizing landmarks, trajectories and distances between landmarks and the given trajectory.
draw_landmarks_curve function in this package does this job.
4.2. Color-coding
Visaulizing the feature mappings in terms of color-coding.
colorcoding function in this package does this job.
5. Curves, points and distances
By taking the advantage of distance funcion in this package one can compute the followings:
5.1. The minimum distance between a point and any (complicated) piecewise linear curve/curves
Usage: See [i].
Example:
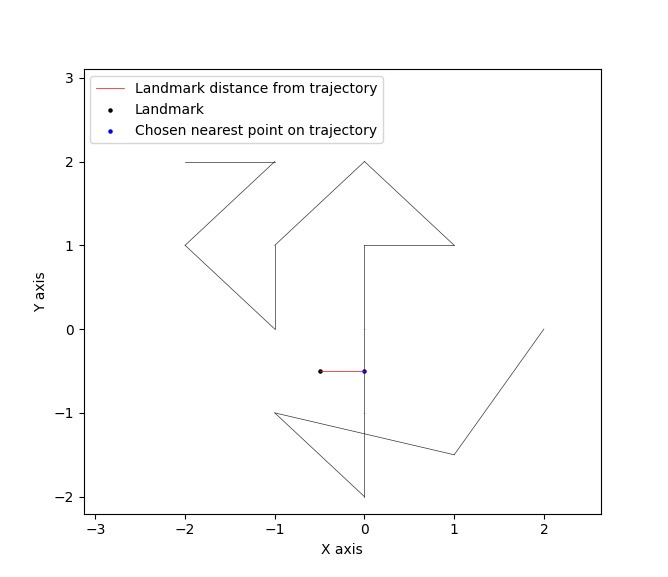
Note: The figure is drawn by draw_landmarks_trajectory function of this package.
Remark: Notice argmin points are chosen by the smallest index if there is a tie.
5.2. The minimum distance of all points in a set of points from a curve/curves simultaneously
Usage: See [ii].
Example:
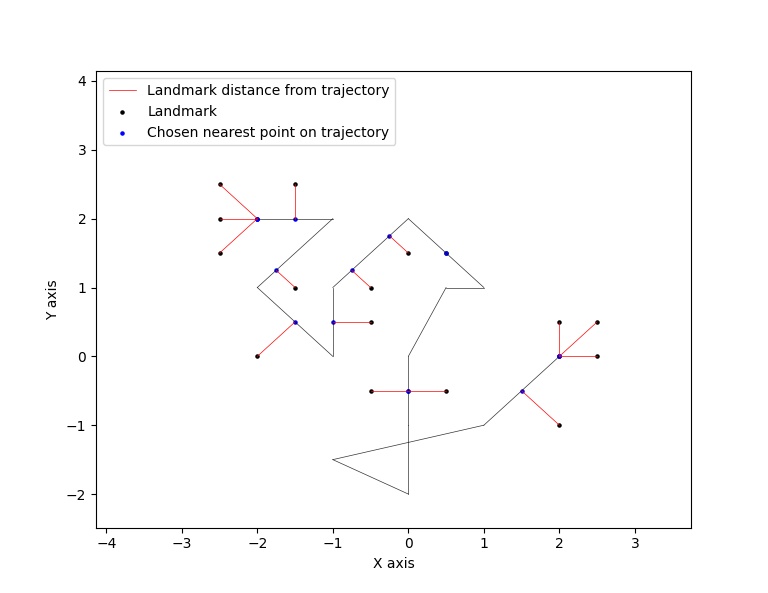
Note: The figure is drawn by draw_landmarks_trajectory function of this package.
Remark: Notice argmin points are chosen by the smallest index if there is a tie.
5.3. The minimum distance of a point/set of points from a line segment
Usage: See [iii].
Examples:
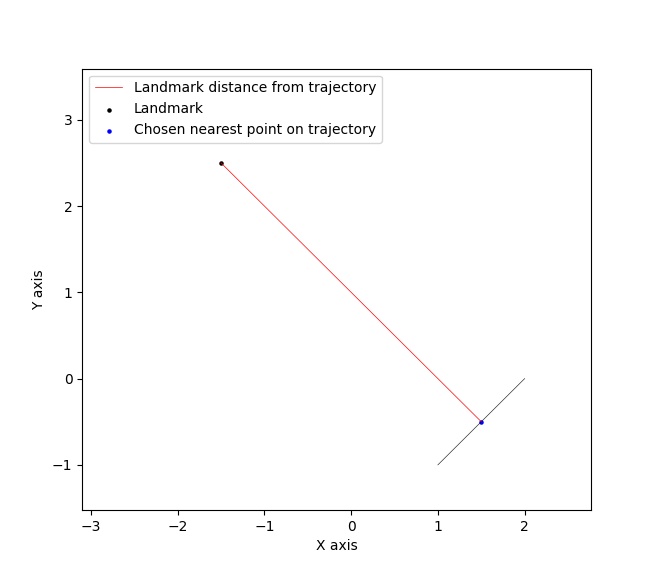
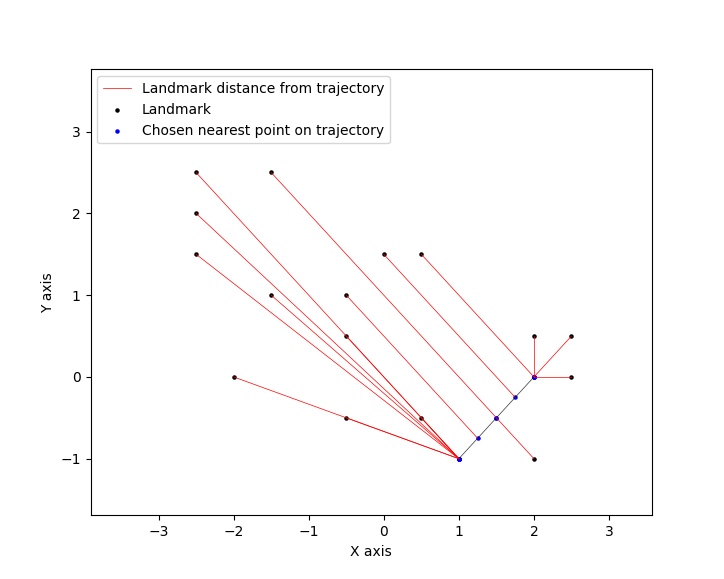
Note: The figures are drawn by draw_landmarks_trajectory function of this package.
Also, this class helps in calculating:
5.4. The closest curve from a set of curves to a given set of points
This is achievable by considering a cost function like the least mean square cost.
5.5. The minimum distance between a set of points and a curve
This is not equivalent to the part 5.2 But one can do as part 5.2 then take minimum.
Installation
First of all make sure that you have already installed Python from https://www.python.org. Then to install this package:
With pip
$ pip install trjtrypyWith git
$ git clone https://github.com/GoldenStarCode/trjtrypy.git
$ cd trjtrpy
$ python setup.py install
Documentation
trjtrypy.featureMappings.curve2vec
trjtrypy.featureMappings.curve2vec(landmarks, trajectories, version=’unsigned’, sigma=1, segIndx=False, argPnts=False)
Maps each curve in curves to a vector of size len(landmarks) using the signed or unsigned feature mapping introduced in the references.
- Parameters
- landmarks: ndarray of shape (len(landmarks), 2)
An array of points in R^2 that their distances from trajectories should be measured.
- trajectories: ndarray of shape (len(trajectories), )
Trajectories are piecewise linear curves in R^2 of shape (n, 2). version: str (‘signed’, ‘unsigned’), default=’unsigned’ Determines which version of the feature mappings is utilized.
- sigma: float, default=1
A positive real number specifying the Gaussian weight parameter employed in the definition of the signed feature mapping. So, it will be effective only when version=’signed’.
- segIndx: bool (True, False), default=False
Being True or False determines whether the function outputs the indices of segments selected by the landmarks.
- argPnts: bool (True, False), default=False
Setting True or False specifies if the function outputs the nearest points on trajectories to landmarks.
- Returns
- ndarray
The array of mapped vectors under the signed/unsigned feature mapping. Moreover, when segIndx or argPnts are called an array of dictionaries including the feature mapping values, selected segments’ indices or argmin points respectively for all trajectories.
Remark
Notice that when version='signed', the trajectories passed into the function must be semi-simple (i.e., countably many self crossings are allowed). However, the code will be run for any trajectory but it will possibly assign an incorrect sign to the values.
Examples
>>> import numpy as np
>>> import trjtrypy as tt
>>> trajectory1 = np.array([[0,0], [2,2], [5,-1], [7,0]])
>>> trajectory2 = np.array([[-2,2], [-1,2], [-2,1], [-1,0], [-1,1], [0,2], [1,1], [0,1], [0,0], [0,-1], [0,-2], [-1,-1], [1,-1], [2,0]])
>>> trajectories = np.array([trajectory1, trajectory2], dtype=object) # or [trajectory1, trajectory2]
>>> landmarks = np.array([[2,-1], [3,3], [2,0]]) # or [[2,-1], [3,3], [2,0]]Default (unsigned feature mapping):
>>> fms = tt.featureMappings.curve2vec(landmarks, trajectories)
>>> fms # An array containing unsigned feature mapping of trajectories
array([[2.12132034e+00, 1.41421356e+00, 1.41421356e+00],
      [7.07106781e-01, 2.82842712e+00, 3.14018492e-16]])
>>> fms[0] # Vectorized form of trajectory1 under curve2vec feature mapping
array([2.12132034e+00, 1.41421356e+00, 1.41421356e+00])
>>> fms[1] # Vectorized form of trajectory2 under curve2vec feature mapping
array([7.07106781e-01, 2.82842712e+00, 3.14018492e-16])
When version='signed' and sigma is given:
>>> signfms = tt.featureMappings.curve2vec(landmarks, trajectories, version='signed', sigma=2)
>>> signfms # An array containing signed feature mapping of trajectories
array([[-3.44345942e-01,  4.28881942e-01, -4.28881942e-01],
    [-3.12009772e-01,  1.91392993e-01, -1.57009246e-16]])
>>> signfms[0] # Vectorized form of trajectory1 under curve2vec feature mapping
array([-3.44345942e-01,  4.28881942e-01, -4.28881942e-01])
>>> signfms[1] # Vectorized form of trajectory2 under curve2vec feature mapping
array([-3.12009772e-01,  1.91392993e-01, -1.57009246e-16])
In both signed and unsigned versions setting segIndx=True will return an array of dictionaries:
>>> segindxfms = tt.featureMappings.curve2vec(landmarks, trajectories, segIndx=True)
>>> segindxfms # See figure 1 and figure 2
array([{'UnsignedCurve2Vec': array([2.12132034, 1.41421356, 1.41421356]), 'SelectedSegmentsIndex': array([0, 0, 0], dtype=int64)},
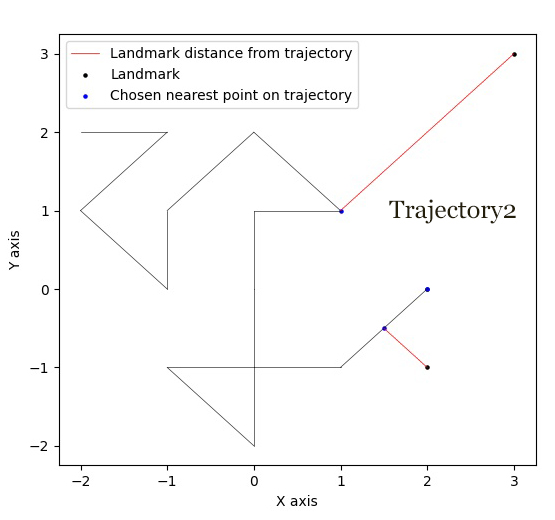
{'UnsignedCurve2Vec': array([7.07106781e-01, 2.82842712e+00, 3.14018492e-16]), 'SelectedSegmentsIndex': array([12, 5, 12], dtype=int64)}],
dtype=object)
>>> segindxfms[0] # See figure 1
{'SelectedSegmentsIndex': array([0, 0, 0]),
'UnsignedCurve2Vec': array([2.12132034, 1.41421356, 1.41421356])}
>>> segindxfms[0]['SelectedSegmentsIndex'] # Output determines that which segments of trajectory1 are selected by the landmarks. As an example, first landmark has selected the first segment (0 index segment) of trajectory1.
array([0, 0, 0])
>>> segindxfms[0]['UnsignedCurve2Vec'] # Output determines landmarks unsigned distances from trajectory1. As an example, first landmark unsigned distance from trajectory1 is 2.12132034.
array([2.12132034, 1.41421356, 1.41421356])
>>> segindxfms[1]
{'UnsignedCurve2Vec': array([7.07106781e-01, 2.82842712e+00, 3.14018492e-16]), 'SelectedSegmentsIndex': array([12, 5, 12], dtype=int64)}Also, setting argPnts=True will return argmin points selected by landmarks:
>>> argminfms = tt.featureMappings.curve2vec(landmarks, trajectories, argPnts=True)
>>> argminfms # See figure 1 and figure 2
array([{'UnsignedCurve2Vec': array([2.12132034, 1.41421356, 1.41421356]),
        'ArgminPoints': array([[0.5, 0.5], [2. , 2. ], [1. , 1. ]])},
    {'UnsignedCurve2Vec': array([7.07106781e-01, 2.82842712e+00, 3.14018492e-16]),
    'ArgminPoints': array([[ 1.50000000e+00, -5.00000000e-01], [ 1.00000000e+00,  1.00000000e+00], [ 2.00000000e+00, -2.22044605e-16]])}], dtype=object)
>>> argminfms[0] # See figure 1
{'ArgminPoints': array([[0.5, 0.5], [2. , 2. ], [1. , 1. ]]),
'UnsignedCurve2Vec': array([2.12132034, 1.41421356, 1.41421356])}
>>> argminfms[0]['ArgminPoints'] # Output determines which points of trajectory1 are selected by the landmarks. As an example, first landmark selects the point [0.5, 0.5] on trajectory1.
array([[0.5, 0.5], [2. , 2. ], [1. , 1. ]])
>>> argminfms[0]['UnsignedCurve2Vec']  # Output determines landmarks unsigned distances from trajectory1. As an example, first landmark unsigned distance from trajectory1 is 2.12132034.
array([2.12132034, 1.41421356, 1.41421356])
>>> argminfms[1]
{'UnsignedCurve2Vec': array([7.07106781e-01, 2.82842712e+00, 3.14018492e-16]),
'ArgminPoints': array([[ 1.50000000e+00, -5.00000000e-01], [ 1.00000000e+00, 1.00000000e+00], [ 2.00000000e+00, -2.22044605e-16]])}- Figure 1:
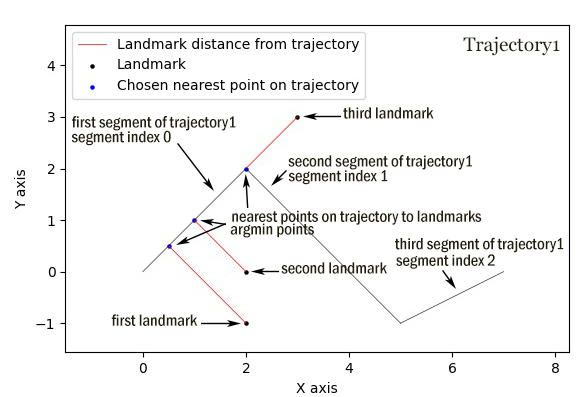
Remark: Notice argmin points are chosen by the smallest index if there is a tie.
- Figure 2:
A combination of above functionalities can also be used:
>>> tt.featureMappings.curve2vec(landmarks, trajectories, segIndx=True, argPnts=True)
array([{'UnsignedCurve2Vec': array([2.12132034, 1.41421356, 1.41421356]),
        'SelectedSegmentsIndex': array([0, 0, 0], dtype=int64),
        'ArgminPoints': array([[0.5, 0.5], [2. , 2. ], [1. , 1. ]])},
    {'UnsignedCurve2Vec': array([7.07106781e-01, 2.82842712e+00, 3.14018492e-16]),
     'SelectedSegmentsIndex': array([12,  5, 12], dtype=int64),
     'ArgminPoints': array([[ 1.50000000e+00, -5.00000000e-01], [ 1.00000000e+00,  1.00000000e+00], [ 2.00000000e+00, -2.22044605e-16]])}], dtype=object)
>>> tt.featureMappings.curve2vec(landmarks, trajectories, version='signed', sigma=0.9, segIndx=True, argPnts=True)
array([{'SignedCurve2Vec': array([-0.00911206,  0.1330272 , -0.1330272 ]),
        'SelectedSegmentsIndex': array([0, 0, 0], dtype=int64),
        'ArgminPoints': array([[0.5, 0.5], [2. , 2. ], [1. , 1. ]])},
    {'SignedCurve2Vec': array([-4.23798562e-01,  1.61426291e-04, -3.48909435e-16]),
     'SelectedSegmentsIndex': array([12,  5, 12], dtype=int64),
     'ArgminPoints': array([[ 1.50000000e+00, -5.00000000e-01], [ 1.00000000e+00,  1.00000000e+00], [ 2.00000000e+00, -2.22044605e-16]])}], dtype=object)
trjtrypy.distances.d_Q
trjtrypy.distances.d_Q(landmarks, trajectory1, trajectory2, version=’unsigned’, sigma=1, p=2)
The landmark-based signed/unsigned distance d_Q according to the definitions in the related references is computed.
- Parameters
- landmarks: ndarray of shape (len(landmarks), 2)
An array containing coordinates of landmarks in each row.
- trajectory1: ndarray of shape (len(trajectory1), 2)
An array that contains the waypoints of trajectory1 consecutively.
- trajectory2: ndarray of shape (len(trajectory2), 2)
An array that contains the waypoints of trajectory2 consecutively.
- version: str (‘signed’, ‘unsigned’), default=’unsigned’
Determines which version of the feature mappings is utilized.
- sigma: float, default=1
A positive real number specifying the Gaussian weight parameter employed in the definition of the signed distance. So, it will be effective only when version=’signed’.
- p: float (1<=p<=infinity), default=2
Specifies the p-norm used in calculations.
- Returns
- float
The d_Q distance of trajectory1 and trajectory2.
Examples
>>> import numpy as np
>>> import trjtrypy as tt
>>> trajectory1 = np.array([[0,0], [2,2], [5,-1], [7,0]])
>>> trajectory2 = np.array([[1,1], [2,2], [4,-2], [4,0]])
>>> trajectories = np.array([trajectory1, trajectory2], dtype=object) # or [trajectory1, trajectory2]
>>> landmarks = np.array([[2,-1], [3,3], [2,0]]) # or [[2,-1], [3,3], [2,0]]>>> tt.distances.d_Q(landmarks, trajectory1, trajectory2)
0.5410108081367118
>>> tt.distances.d_Q(landmarks, trajectory1, trajectory2, p=5) # Using 5-norm to calculate distacne of two trajcetories.
0.641559854784373
>>> tt.distances.d_Q(landmarks, trajectory1, trajectory2, version='signed', sigma=0.1) # Using signed version of the feature mapping in computation (sigma is needed in this version).
9.320212490006313e-35
>>> tt.distances.d_Q(landmarks, trajectory1, trajectory2, version='signed', sigma=0.1, p=float('inf')) # Using infinity-norm for calculating distance of two trajectories.
1.614308157002897e-34trjtrypy.distances.d_Q_pi
trjtrypy.distances.d_Q_pi(landmarks, trajectory1, trajectory2, p=1)
The landmark-based distance d_Q_pi according to the definition in the related reference is computed.
- Parameters
- landmarks: ndarray of shape (len(landmarks), 2)
An array containing coordinates of landmarks in each row.
- trajectory1: ndarray of shape (len(trajectory1), 2)
An array that contains the waypoints of trajectory1 consecutively.
- trajectory2: ndarray of shape (len(trajectory2), 2)
An array that contains the waypoints of trajectory2 consecutively.
- p: float (1<=p<=infinity), default=2
Specifies the p-norm used in calculations.
- Returns
- float
The d_Q_pi distance of trajectory1 and trajectory2.
Examples
>>> import numpy as np
>>> import trjtrypy as tt
>>> trajectory1 = np.array([[0,0], [2,2], [5,-1], [7,0]])
>>> trajectory2 = np.array([[1,1], [2,2], [4,-2], [4,0]])
>>> trajectories = np.array([trajectory1, trajectory2], dtype=object) # or [trajectory1, trajectory2]
>>> landmarks = np.array([[2,-1], [3,3], [2,0]]) # or [[2,-1], [3,3], [2,0]]>>> tt.distances.d_Q_pi(landmarks, trajectory1, trajectory2)
1.5811388300841898trjtrypy.visualizations.draw_landmarks_trajectory
trjtrypy.visualizations.draw_landmarks_trajectory(landmarks, trajectory, version=’unsigned’, trj=True, lndmarks=True, dists=True, argminpnts=True, zoom=None, figsize=(10,10))
An interactive visualization tool that allows the user to draw landmarks, trajectory, distances and nearest points of trajectory to the landmarks.
- Parameters
- landmarks: ndarray of shape (len(landmarks), 2)
An array containing coordinates of landmarks in each row.
- trajectory: ndarray of shape (len(trajectory), 2)
An array that contains the waypoints of the trajectory consecutively.
- version: str (‘signed’, ‘unsigned’), default=’unsigned’
Determines which version of the feature mappings is utilized.
- trj: bool (True, False), default=True
Being True or False specifies whether the trajectory should be drawn or not.
- lndmarks: bool (True, False), default=True
Setting True or False determines whether landmarks should be drawn or not.
- dists: bool (True, False), default=True
Setting True or False determines whether distances (segments connecting a landmark to the nearest point on trajectory to that landmark) should be drawn or not.
- argminpnts: bool (True, False), default=True
Setting True or False specifies if the nearest points on trajectory to landmarks should be drawn or not.
- zoom: float
A positive float number which determines zooming in or out in a fixed figure size.
- figsize: tuple
A tuple consisting of horizontal and vertical lengths of the output figure.
- Returns
A figure that can include the trajectory, landmarks, distances, argmin points according to the selected properties by the user.
Examples
>>> import numpy as np
>>> import trjtrypy as tt
>>> trajectory = np.array([[-2,2], [-1,2], [-2,1], [-1,0], [-1,1], [0,2], [1,1], [0.5,1], [0,0], [0,-1], [0,-2], [-1,-1.5], [1,-1], [2,0]])
>>> landmarks = np.array([[-2.5,1.5], [-2.5,2], [-2.5,2.5], [-2,0], [-1.5,1], [-1.5,2.5], [-0.5,-0.5], [-0.5,0.5], [-0.5,1], [0,1.5], [0.5,-0.5], [0.5,1.5], [2,-1], [2,0.5], [2.5,0], [2.5,0.5]]) # or [[-2.5,1.5], [-2.5,2], [-2.5,2.5], [-2,0], [-1.5,1], [-1.5,2.5], [-0.5,-0.5], [-0.5,0.5], [-0.5,1], [0,1.5], [0.5,-0.5], [0.5,1.5], [2,-1], [2,0.5], [2.5,0], [2.5,0.5]]>>> tt.visualizations.draw_landmarks_trajectory(landmarks, trajectory, version='unsigned', trj=True, lndmarks=True, dists=True, argminpnts=True, zoom=None, figsize=(5,10))
Remark: Notice argmin points are chosen by the smallest index if there is a tie.
In signed version the trajectory will be drawn in a directed form. As mentioned in reference distances in end points of the trajectory is not 2-norm, so those distances are shown by dotted line segments in visualization:
>>> tt.visualizations.draw_landmarks_trajectory(landmarks,trajectory,version='signed',trj=True,lndmarks=True,dists=True,argminpnts=True,zoom=None,figsize=(10,10))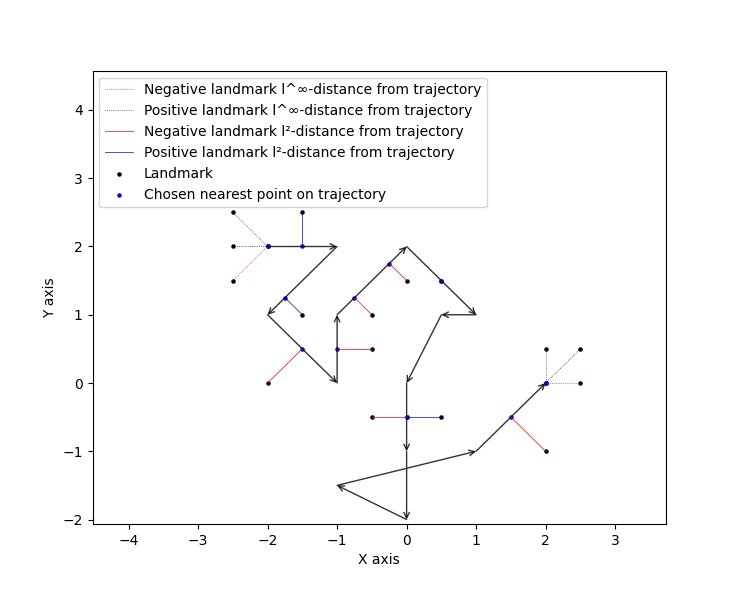
Remark: Notice argmin points are chosen by the smallest index if there is a tie.
trjtrypy.visualizations.colorcoding
trjtrypy.visualizations.colorcoding(vectorizedfunc, trajectory, version=’unsigned’, zoom=None, dpi=50, figsize=(10,10))
Visualizing the specified feature mapping by color considering every point on a rectangular region, that includes the trajectory, as a potential landmark.
- Parameters
- vectorizedfunc: A vectorized function
Vectorized form of the function that is used to get the feature mapping.
- trajectory: ndarray of shape (len(trajectory), 2)
An array that contains the waypoints of the trajectory consecutively.
- version: str (‘signed’, ‘unsigned’), default=’unsigned’
Determines which version of the feature mappings is utilized. For unsigned version the sequential colormap is used but for signed version the diverging colormap is employed.
- zoom: float
A positive float number which determines zooming in or out in a fixed figure size.
- dpi: int, default=50
Specifies the resolution of the figure.
- figsize: tuple
A tuple consisting of horizontal and vertical lengths of the output figure.
- Returns
The color-coded visualization of a specified feature mapping.
Examples
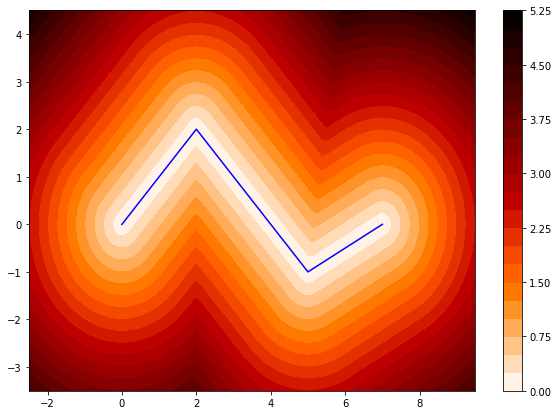
Color-coding of the unsigned version of the feature mapping:
import numpy as np
import trjtrypy as tt


trajectory=np.array([[0,0], [2,2], [5,-1], [7,0]]) # or [[0,0], [2,2], [5,-1], [7,0]]
# define the feature mapping function as follows:
def fmfunc(x,y):
   return tt.featureMappings.curve2vec([[x,y]], [trajectory])[0]
# vectorize above function with numpy vectorize function
fmfunc=np.vectorize(fmfunc)
# color-code
tt.visualizations.colorcoding(fmfunc, trajectory, figsize=(10,7), zoom=.4) # figure 3
Figure 3:
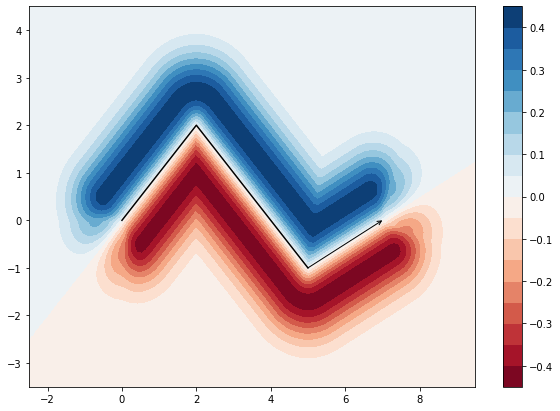
Color-coding of the signed version of the feature mapping:
import numpy as np
import trjtrypy as tt


trajectory=np.array([[0,0], [2,2], [5,-1], [7,0]]) # or [[0,0], [2,2], [5,-1], [7,0]]
# define the feature mapping function as follows:
def fmfunc(x,y):
   return tt.featureMappings.curve2vec([[x,y]], [trajectory], version='signed')[0]
# vectorize above function with numpy vectorize function
fmfunc=np.vectorize(fmfunc)
# color-code
tt.visualizations.colorcoding(fmfunc, trajectory, version='signed', figsize=(10,7), zoom=.4) # figure 4
Figure 4:
trjtrypy.basedists.distacne
distance(points, curves, version=’unsigned’, segIndx=False, argPnts=False)
Calculates the distance of each point in points from each curve in curves at the same time.
- Parameters
- points: ndarray of shape (len(points),)
An array that contains coordinates of points in each row.
- curves: ndarray of shape (len(curves),)
Piecewise linear curves in R^2 of shape (n, 2). Notice n can be different for each curve.
- version: str (‘unsigned’, ‘signed’), default=’unsigned’
Determines unsigned or signed distance that is going to be computed.
- segIndx: bool (True, False), default=False
Being True or False determines whether the function outputs the indices of segments selected by the points.
- argPnts: bool (True, False), default=False
Setting True or False specifies if the function outputs the nearest points on curves to points.
- Returns
- ndarray
The array of unsigned/signed distances. Moreover, when segIndx or argPnts are called an array of dictionaries including the distance values, selected segments’ indices or argmin points respectively for all curves is given.
Remark
Note that the signed version implemented here is different from the signed version used in curve2vec feature mapping. Indeed, the signed distance that is computed by distance function here is unsigned distance value with sign according to the right hand rule considering the orientation of the curve.
Signed version of this function will give zero for points that their sign cannot be determined by the right hand rule. As an example consider the curve [ [0,0], [1,1] ] and point [-1,-1]. Then the value of the signed version is 0.
Examples
The minimum distance between a point and any (complicated) piecewise linear curve/curves:
The minimum distance between a point and any (complicated) piecewise linear curve:
import numpy as np
import trjtrypy as tt


# define a point
apoint=np.array([[-0.5, -0.5]])
# define a curve
curve=np.array([[-2,2], [-1,2], [-2,1], [-1,0], [-1,1], [0,2], [1,1], [0,1], [0,0], [0,-1], [0,-2], [-1,-1], [1,-1.5], [2,0]])

# make apoint and curve appropriate for distance function as inputs
points=apoint
curves=np.array([curve], dtype=object)

# compute unsigned distance
tt.basedists.distance(points, curves) # returns array([[0.5]])

# compute signed distance
tt.basedists.distance(points, curves, version='signed') # returns array([[-0.5]])
The minimum distance between a point and any (complicated) piecewise linear curves:
import numpy as np
import trjtrypy as tt


# define a point
apoint=np.array([[-0.5, -0.5]])
# define curve1
curve1=np.array([[-2,2], [-1,2], [-2,1], [-1,0], [-1,1], [0,2], [1,1], [0,1], [0,0], [0,-1], [0,-2], [-1,-1], [1,-1.5], [2,0]])
# define curve2
curve2=np.array([[0,0], [2,2], [5,-1], [7,0]])

# make apoint, curve1 and curve2 appropriate for distance function as inputs
points=apoint
curves=np.array([curve1, curve2], dtype=object)

# compute unsigned distances
tt.basedists.distance(points, curves) # returns array([[0.5       ],
                                      #                [0.70710678]])

# compute signed distances
tt.basedists.distance(points, curves, version='signed') # returns array([[-0.5],
# [ 0. ]]) this is zero because point [-0.5,-0.5] is positioned at the direction of the first segment of curve2The minimum distance of all points in a set of points from a curve/curves simultaneously:
The minimum distance of all points in a set of points from a curve simultaneously:
import numpy as np
from trjtrypy.basedists import distance


# define a set of points
setpoints=np.array([[-2.5,1.5], [-2.5,2], [-2.5,2.5], [-2,0], [-1.5,1], [-1.5,2.5], [-0.5,-0.5], [-0.5,0.5], [-0.5,1], [0,1.5], [0.5,-0.5], [0.5,1.5], [2,-1], [2,0.5], [2.5,0], [2.5,0.5]])
# define a curve
curve=np.array([[-2,2], [-1,2], [-2,1], [-1,0], [-1,1], [0,2], [1,1], [0.5,1], [0,0], [0,-1], [0,-2], [-1,-1.5], [1,-1], [2,0]])


# make setpoints and curve usable for distance function as inputs
points=setpoints
curves=np.array([curve], dtype=object)

# compute unsigned distance
distance(points, curves) # returns array([[7.07106781e-01, 5.00000000e-01, 7.07106781e-01, 7.07106781e-01,
                         #                 3.53553391e-01, 5.00000000e-01, 5.00000000e-01, 5.00000000e-01,
                         #                 3.53553391e-01, 3.53553391e-01, 5.00000000e-01, 1.57009246e-16,
                         #                 7.07106781e-01, 5.00000000e-01, 5.00000000e-01, 7.07106781e-01]])

# compute signed distance
distance(points, curves, version='signed') # returns array([[-7.07106781e-01,  0.00000000e+00,  7.07106781e-01,
                                           #                 -7.07106781e-01,  3.53553391e-01,  5.00000000e-01,
                                           #                 -5.00000000e-01, -5.00000000e-01, -3.53553391e-01,
                                           #                 -3.53553391e-01,  5.00000000e-01, -1.57009246e-16,
                                           #                 -7.07106781e-01,  5.00000000e-01, -5.00000000e-01,
                                           #                  0.00000000e+00]])
The minimum distance of all points in a set of points from curves simultaneously:
import numpy as np
from trjtrypy.basedists import distance


# define a set of points
setpoints=np.array([[-2.5,1.5], [-2.5,2], [-2.5,2.5], [-2,0], [-1.5,1], [-1.5,2.5], [-0.5,-0.5], [-0.5,0.5], [-0.5,1], [0,1.5], [0.5,-0.5], [0.5,1.5], [2,-1], [2,0.5], [2.5,0], [2.5,0.5]])
# define curve1
curve1=np.array([[-2,2], [-1,2], [-2,1], [-1,0], [-1,1], [0,2], [1,1], [0.5,1], [0,0], [0,-1], [0,-2], [-1,-1.5], [1,-1], [2,0]])
# define curve2
curve2=np.array([[0,0], [2,2], [5,-1], [7,0]])

# make setpoints, curve1 and curve2 appropriate for distance function as inputs
points=setpoints
curves=np.array([curve1, curve2], dtype=object)

# compute unsigned distance
distance(points, curves) # returns array([[7.07106781e-01, 5.00000000e-01, 7.07106781e-01, 7.07106781e-01,
                         #                 3.53553391e-01, 5.00000000e-01, 5.00000000e-01, 5.00000000e-01,
                         #                 3.53553391e-01, 3.53553391e-01, 5.00000000e-01, 1.57009246e-16,
                         #                 7.07106781e-01, 5.00000000e-01, 5.00000000e-01, 7.07106781e-01],
                         #                [2.91547595e+00, 3.20156212e+00, 3.53553391e+00, 2.00000000e+00,
                         #                 1.80277564e+00, 2.82842712e+00, 7.07106781e-01, 7.07106781e-01,
                         #                 1.06066017e+00, 1.06066017e+00, 7.07106781e-01, 7.07106781e-01,
                         #                 2.12132034e+00, 1.06066017e+00, 1.06066017e+00, 7.07106781e-01]])

# compute signed distance
distance(points, curves, version='signed') # returns array([[-7.07106781e-01,  0.00000000e+00,  7.07106781e-01,
                                           #                 -7.07106781e-01,  3.53553391e-01,  5.00000000e-01,
                                           #                 -5.00000000e-01, -5.00000000e-01, -3.53553391e-01,
                                           #                 -3.53553391e-01,  5.00000000e-01, -1.57009246e-16,
                                           #                 -7.07106781e-01,  5.00000000e-01, -5.00000000e-01,
                                           #                  0.00000000e+00],
                                           #                [ 2.91547595e+00,  3.20156212e+00,  3.53553391e+00,
                                           #                  2.00000000e+00,  1.80277564e+00,  2.82842712e+00,
                                           #                  0.00000000e+00,  7.07106781e-01,  1.06066017e+00,
                                           #                  1.06066017e+00, -7.07106781e-01,  7.07106781e-01,
                                           #                  -2.12132034e+00, -1.06066017e+00, -1.06066017e+00,
# -7.07106781e-01]])The minimum distance of a point/set of points from a line segment:
The minimum distance of a point from a line segment:
import numpy as np
from trjtrypy.basedists import distance


# define a point
apoint = np.array([[-0.5, -0.5]])
# define a line segment
linesegment = np.array([[1,-1], [2,0]])

# make apoint and linesegment appropriate for distance function as inputs
points = apoint
curves = np.array([linesegment], dtype=object)

# compute unsigned distance
distance(points, curves) # array([[1.58113883]])

# compute signed distance
distance(points, curves) # array([[1.58113883]])
The minimum distance of a set of points from a line segment:
import numpy as np
from trjtrypy.basedists import distance


#define a set of points
setpoints = np.array([[-2.5,1.5], [-2.5,2], [-2.5,2.5], [-2,0], [-1.5,1], [-1.5,2.5], [-0.5,-0.5], [-0.5,0.5], [-0.5,1], [0,1.5], [0.5,-0.5], [0.5,1.5], [2,-1], [2,0.5], [2.5,0], [2.5,0.5]])
# define a line segment
linesegment = np.array([[[1,-1], [2,0]]])

# make setpoints and linesegment applicable for distance function as inputs
points = setpoints
curves = linesegment


# compute unsigned distance
distance(points, curves) # array([[4.30116263, 4.60977223, 4.94974747, 3.16227766, 3.20156212,
                         #         4.24264069, 1.58113883, 2.12132034, 2.47487373, 2.47487373,
                         #         0.70710678, 2.12132034, 0.70710678, 0.5       , 0.5       ,
                         #         0.70710678]])
# compute signed distance
distance(points, curves) # array([[4.30116263,  4.60977223,  4.94974747,  3.16227766,  3.20156212,
                         #         4.24264069,  1.58113883,  2.12132034,  2.47487373,  2.47487373,
                         #         0.70710678,  2.12132034, -0.70710678,  0.5       , -0.5       ,
                         #         0.        ]])
Further applications
1. Application for curves
One can approximate any continuous curve via trajectories with a sufficient accuracy, then apply this package functionalities for the resulted approximate version of the curve.
2. Application for two dimensional times series
By connecting consecutive points in a 2d times series one can make a trajectory in order to use this package functionalities.
3. Application in Machine Learning
One of the biggest advantages of this package is enabling machine learning algorithms on trajectory datasets. In fact, using curve2vec featurization one can convert each trajectory to a vector and thus apply any machine learning algorithm. For instance, one can do classification tasks using machine learning or deep learning classifiers such as Support Vector Machine, Decision Tree, Random Forest, Neural Networks, etc. as it is done in the references [1], [2].
It is needless to say that using d_Q or d_Q_pi distances as similarity measures one may do Clustering or apply KNN (K-Nearest Neighborhood).
Data sets
Here we include the link to several famous trajectory data sets:
Geolife trajectory dataset from Microsoft: https://msropendata.com/datasets/d19b353b-7483-4db7-a828-b130f6d1f035
T-Drive trajectory dataset from Microsoft: https://www.microsoft.com/en-us/research/publication/t-drive-driving-directions-based-on-taxi-trajectories/
Car-Bus trajectory dataset from UCI Machine Learning Repository: https://archive.ics.uci.edu/ml/datasets/GPS+Trajectories
Character trajectories dataset from UCI Machine Learning Repository: https://archive.ics.uci.edu/ml/datasets/Character+Trajectories
References
Citation
If you found this package or information helpful, please cite above references.
Release history Release notifications | RSS feed

Download files
Download the file for your platform. If you're not sure which to choose, learn more about installing packages.


