A matplotlib wrapper for fast and easy generation of reusable plots

Project description
easyplot
easyplot: A matplotlib wrapper written in Python to enable fast and easy creation of reusable plots.
The EasyPlot module provides a thin wrapper to matplotlib, enabling fast and easy generation of beautiful, annotated plots with minimal code. It also enables the reuse of EasyPlot instances to generate new plots that maintain state from previous plots allowing for quick and easy generation of multiple plots of the same type. EasyPlot supports all commonly used plot parameters and allows access to the underlying figure and axes instances to allow the user to further customize the generated plots if necessary.
For more details and examples please see the included package documentation and the IPython Notebook containing documentation and an extensive list of examples: http://nbviewer.ipython.org/github/HamsterHuey/easyplot/blob/master/docs/easyplot_docs.ipynb
Requirements
Python 2.7.2+
matplotlib
Use of the IPython shell is strongly recommended with this library (and matplotlib plotting in general). The %matplotlib magic command in IPython (or starting IPython using ipython --matplotlib) implements a number of backend tweaks to enable robust, interactive plotting using matplotlib.
Installation
You can use the following commands to install EasyPlot:
pip install easyplot
or
easy_install easyplot
Alternatively, you could download the package manually from the Python Package Index: https://pypi.python.org/pypi/EasyPlot, unzip it, navigate into the package, and use the command:
python setup.py install
or
pip install .
Motivation and background
Setting up aesthetically pleasing plots with plot titles, axes labels, etc requires several lines of boilerplate code in vanilla matplotlib. As an example, creating a basic plot in matplotlib requires the following lines of code:
fig, ax = plt.subplots()
ax.plot(x, x**2, 'b-o', label="y = x**2")
ax.plot(x, x**3, 'r--s', label="y = x**3")
ax.legend(loc='best')
ax.grid()
ax.set_xlabel('x')
ax.set_ylabel('y')
ax.set_title('title')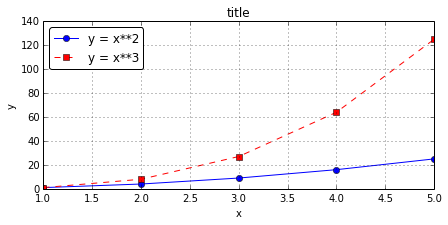
Pylab alleviates some of this, but still requires calls to a number of different functions that are commonly used (such as xlabel, xlim, etc.). More complicated plots can require several more lines of code. Typing all this code every time to generate plots gets tedious very quickly. This situation is further exacerbated when working in an IPython Notebook where all plots typically need to be labeled, annotated and looking their best. Having several lines of code preceeding every plot in a notebook can break the flow of the document and distract from the code/concepts being presented by the author. Furthermore, oftentimes, plots with similar labels and formatting need to be generated repeatedly with different datasets. Generating these sets of plots would require retyping these same lines of boilerplate code across different sections of your code/notebook.
Easyplot is my attempt to address these issues and make generating quick, pleasant looking, annotated plots a bit easier. In keeping with DRY philosophy, easyplot enables the creation of an EasyPlot object that maintains state information of all plot parameters passed to it in order to generate a plot. This can then be easily reused to generate new plots with the user only having to supply any additional plot parameters, or those parameters he or she wishes to override from the previous plot.
Easyplot supports a large number of standard plot parameters that most users typically deal with when plotting in matplotlib. Additionally, it provides methods to access the figure and axes instance for the latest plot, enabling users to perform more custom plot modifications that are not directly supported by easyplot. It also supports interactive plotting where additional plot parameters can be passed to the current plot using the update_plot method. The plot above can be generated using easyplot as follows:
eplot = EasyPlot(x, x**2, 'b-o', label='y = x**2', showlegend=True,
                 xlabel='x', ylabel='y', title='title', grid='on')
eplot.add_plot(x, x**3, 'r--s', label='y = x**3')
Along with the reduced typing, easyplot enables the consolidation and passing of all plot parameters into a single plot call. This is already quite handy, but the real benefit is evident when one needs to generate a new plot with the same plot parameters (such as axis labels and title) but with new data:
eplot.new_plot(x, 1/x, 'g-D', label='y = 1/x')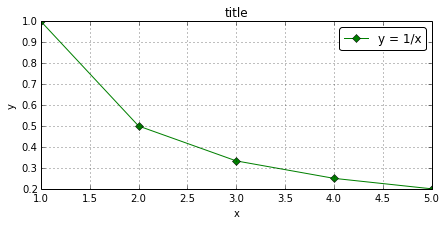
EasyPlot also provides an iter_plot() method that iterates through x, y data and plot parameters that are provided in a list or dictionary format to automatically generate an annotated, multi-line plot with a single statement:
eplot = EasyPlot(xlabel=r'$x$', ylabel='$y$', fontsize=16,
                 colorcycle=["#66c2a5","#fc8d62","#8da0cb"], figsize=(8,5))
eplot.iter_plot(x, y_dict, linestyle=linestyle_dict, marker=marker_dict,
                label=labels_dict, linewidth=3, ms=10, showlegend=True, grid='on')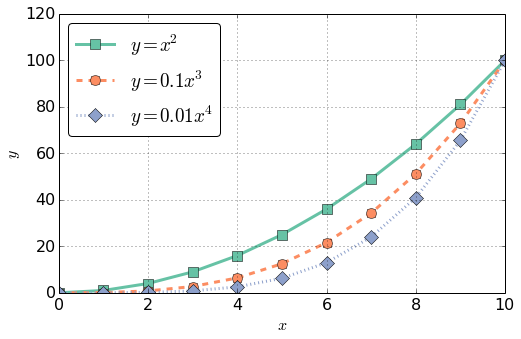
Features
Access to a large number of the most used matplotlib plot parameters under a unified wrapper class
Plot parameter aliases supported. Can be extended by user for arbitrary alias definitions for various plot parameters
Ability to use EasyPlot objects as templates to rapidly generate annotated plots of a similar type
iter_plot() method to easily iterate through x, y datasets and plot multiple plots with a single method call
Draggable legend when using GUI backends (eg: qt, wx, etc.)
Provides access to underlying figure, axes and line2D objects for advanced plot customization
Usage and Examples
For more details and examples, please view the online IPython Notebook containing easyplot documentation and an extensive list of examples: http://nbviewer.ipython.org/github/HamsterHuey/easyplot/blob/master/docs/easyplot_docs.ipynb
Contact
I’d love to hear your comments and/or suggestions. You can get in touch with me via:
eMail: sudeepmandal@gmail.com
Twitter: https://twitter.com/hamsterhuey
Release history Release notifications | RSS feed


Download files
Download the file for your platform. If you're not sure which to choose, learn more about installing packages.


