Gwydion allows users to generate pseudo-random scientific data easily.

Project description
Gwydion
Gwydion allows users to generate pseudo-random scientific data easily.
In the spirit of Faker, Gwydion allows you to generate pseudo-random data using a simple, clean, and customisable API.
Gwydion is named after a trickster from Welsh mythology.
Installation
You can install from PyPI with
pip install gwydion
Examples
Some basic examples of Gwydion objects are given below.
In the first example, we create a simple Linear object, given by the mathematical relationship y = mx + c. When parameters are not set by the user, Gwydion objects will default to suitable random values. Objects will also, by default, add some random noise to the y-data. In the example below we allow the Linear object to generate all of the parameters, but set the number of data points N manually.
from gwydion import Linear

lin = Linear(N=6)

x, y = lin.data
print(x, y, sep='\n')
# [  0.   2.   4.   6.   8.  10.]
# [ -0.17387604   5.59216341  11.77162695  17.70041889  23.55609025  28.67617757]
In this second example, an Exponential function is created with various manually selected parameters. Exponential functions are given by y = I * base**(k*x). In the example below we have set:
The number of data points N = 3,
The intensity I = 10,
The exponent multiplier k = -1,
The x-limits xlim = (0, 10),
And chosen to not add any random noise to the data add_rand = False.
For the Exponential object the default base is not random, but is instead to Euler’s number e = 2.71828.... This fact, combined with k = -1, means that our object below is effectively giving us exponential decay.
from gwydion import Exponential

exp = Exponential(N=3, I=10, k=-1, xlim=(0,10), add_rand=False)

x, y = exp.data
print(x, y, sep='\n')
# [  0.   5.  10.]
# [  1.00000000e+01   6.73794700e-02   4.53999298e-04]
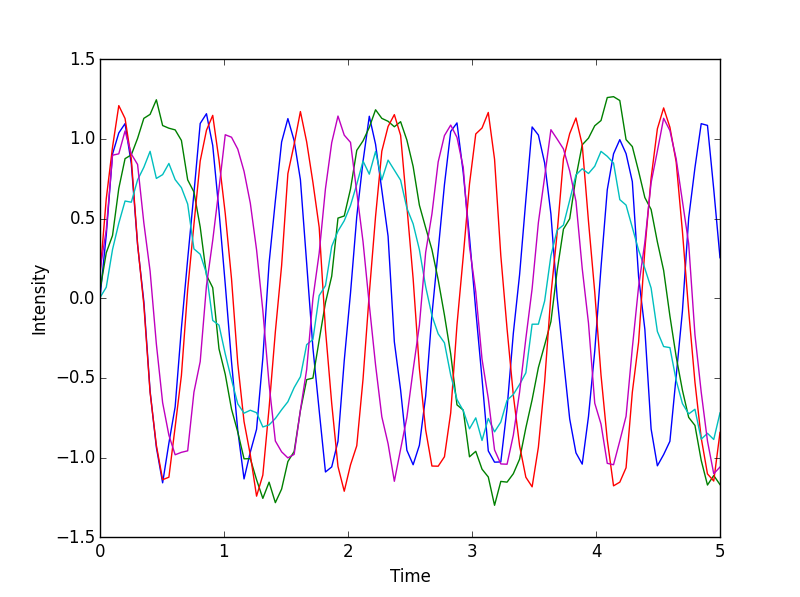
Finally, let’s look at how Gwydion objects work with matplotlib. In the example below, we generate 5 Sine objects using a list comprehension. We can then use the plot function to plot each data set easily.
from gwydion import Sine
import matplotlib.pyplot as plt

sines = [Sine(xlim=(0,5)) for _ in range(5)]

fig, ax = plt.subplots()

for sine in sines:
    sine.plot(ax=ax)

ax.set_xlabel('Time')
ax.set_ylabel('Intensity')

plt.show()
Release history Release notifications | RSS feed


Download files
Download the file for your platform. If you're not sure which to choose, learn more about installing packages.


