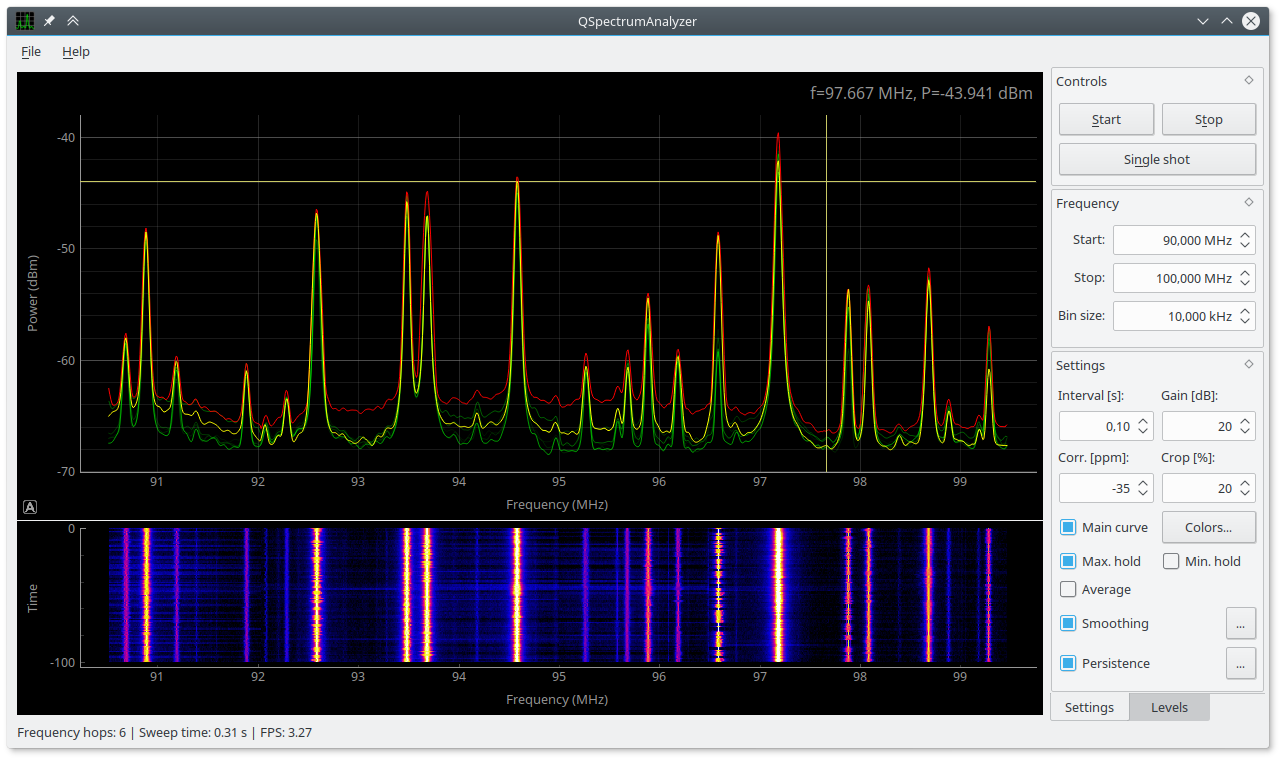
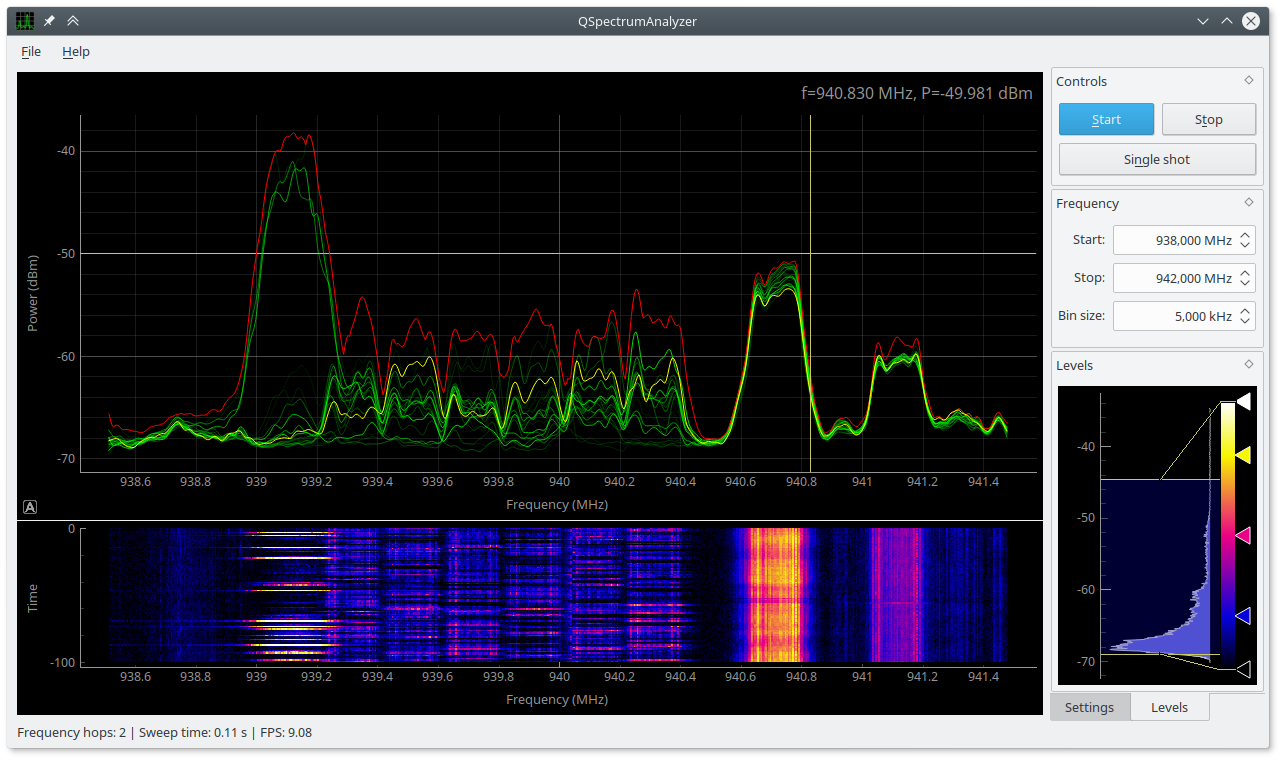
Spectrum analyzer for multiple SDR platforms (PyQtGraph based GUI for soapy_power, rx_power, rtl_power, hackrf_sweep and other backends)

Project description
Spectrum analyzer for multiple SDR platforms (PyQtGraph based GUI for soapy_power, rx_power, rtl_power, hackrf_sweep and other backends)
Screenshots
Requirements
Python >= 3.3
PyQt4 / PyQt5 / PySide / PySide2
PyQtGraph (http://www.pyqtgraph.org)
soapy_power (https://github.com/xmikos/soapy_power)
Optional: rx_tools / rtl-sdr / rtl_power_fftw / hackrf
Backends
Universal SDR backends
soapy_power (https://github.com/xmikos/soapy_power)
soapy_power is default recommended universal backend in QSpectrumAnalyzer. It is based on SoapySDR and supports nearly all SDR platforms (RTL-SDR, HackRF, Airspy, SDRplay, LimeSDR, bladeRF, USRP and some other SDR devices).
rx_power (https://github.com/rxseger/rx_tools)
rx_power (part of rx_tools) is also based on SoapySDR and therefore supports nearly all SDR platforms, but it is much slower than soapy_power, doesn’t support near real-time continuous measurement (minimum interval is 1 second, same as rtl_power) and is little buggy.
RTL-SDR backends
rtl_power (https://github.com/keenerd/rtl-sdr)
You should use Keenerds fork of rtl-sdr (latest Git revision), because rtl_power in original rtl-sdr package (from osmocom.org) is broken (especially when used with cropping).
rtl_power_fftw (https://github.com/AD-Vega/rtl-power-fftw)
Another alternative for RTL-SDR is rtl_power_fftw which has various benefits over rtl_power. E.g. better FFT performance (thanks to use of fftw library) and possibility to use much shorter acquisition time for more real-time continuous measurement (minimum interval in original rtl_power is 1 second, but in rtl_power_fftw you are only limited by number of frequency hops).
HackRF backends
hackrf_sweep (https://github.com/mossmann/hackrf)
hackrf_sweep backend enables wideband spectrum monitoring by rapidly retuning the radio without requiring individual tuning requests from the host computer. This allows unprecedented sweep rate of 8 GHz per second.
Usage
Start QSpectrumAnalyzer by running qspectrumanalyzer.
You can choose which backend you want to use in File -> Settings (or Application menu -> Preferences on Mac OS X), default is soapy_power. Sample rate, path to backend executable and additional backend parameters can be also manually specified there. You can also set waterfall plot history size. Default is 100 lines, be aware that really large sweeps (with a lot of bins) would require a lot of system memory, so don’t make this number too big.
Controls should be intuitive, but if you want consistent results, you should turn off automatic gain control (set gain to some fixed number) and also set crop to 20% or more. For finding out ppm correction factor for your rtl-sdr stick, use kalibrate-rtl.
You can move and zoom plot with mouse, change plot settings or export plots from right-click menu. Waterfall plot black/white levels and color lookup table can be changed in mini-histogram widget (on Levels tab).
Installation
Arch Linux:
Stable version:
git clone https://aur.archlinux.org/qspectrumanalyzer.git
cd qspectrumanalyzer
makepkg -sri
Git master branch:
git clone https://aur.archlinux.org/qspectrumanalyzer-git.git
cd qspectrumanalyzer-git
makepkg -sri
Or simply use pacaur (or any other AUR helper) which will also automatically install all QSpectrumAnalyzer dependencies:
pacaur -S qspectrumanalyzer
pacaur -S qspectrumanalyzer-git
Ubuntu:
# Add SoapySDR PPA to your system
sudo add-apt-repository -y ppa:myriadrf/drivers

# Update list of packages
sudo apt-get update

# Install basic dependencies
sudo apt-get install python3-pip python3-pyqt5 python3-numpy python3-scipy soapysdr python3-soapysdr

# Install SoapySDR drivers for your hardware (e.g. RTL-SDR, Airspy, HackRF, LimeSDR, etc.)
sudo apt-get install soapysdr-module-rtlsdr soapysdr-module-airspy soapysdr-module-hackrf soapysdr-module-lms7

# Install QSpectrumAnalyzer
sudo pip3 install qspectrumanalyzer
Warning! pip will install packages system-wide by default, but you should always use your distribution package manager for this.
You can install it locally only for your current user by running this (without sudo):
pip3 install --user qspectrumanalyzer
Executables will be then placed in ~/.local/bin directory, you can add it to your PATH in ~/.bashrc.
If you want to install QSpectrumAnalyzer directly from Git master branch, you can use this procedure:
git clone https://github.com/xmikos/qspectrumanalyzer.git
cd qspectrumanalyzer
pip3 install --user .
Todo:
show scan progress
allow setting LNB LO frequency
save & load FFT history (allow big waterfall plot saved to file)
automatic peak detection / highlighting
display average noise level
frequency markers / bookmarks with notes (even importing / exporting .csv file with predefined channels, etc.)


