Benchmark resources usage

Project description
Monitor Process Resources Usage
- Bench aims to be a handy tool with these functions:
Monitor CPU time (user time, sys time, real time)
Monitor memory usage (vms usage, rss usage)
Output to TSV(tab-delimited files)
Output benchmarking metrics
Visualize benchmarking over time
Examples
Example 1: simple command
> monitor.py sleep 2
PID Prog    Usr     Sys     Real    MaxVms  MaxRss  AvgVms  AvgRss  Path    Command
22727       sleep   0.000   0.000   2.009   7581696 368640  7581696.0       368640.0        /home/zhanxw/mycode/bench       "sleep 2"
22725       python  0.000   0.000   2.210   78827520        7168000 75189278.1936   6866516.95138   /home/zhanxw/mycode/bench       "/home/zhanxw/python27/bin/python /home/zhanxw/bin/monitor.py sleep 2"
0.00u 0.00s 2.01r (rss)1644kb 0 sleep 2
Example 2: complex shell commands with samping interval equaing 0.5 second
> monitor.py -s -i 0.5 'sleep 2 & sleep 4 & seq 1000000 >/dev/null & wait'
PID Prog    Usr     Sys     Real    MaxVms  MaxRss  AvgVms  AvgRss  Path    Command
30848       sh      0.000   0.000   4.007   12881920        1404928 12881920.0      1404928.0       /home/zhanxw/mycode/bench       "/bin/sh -c sleep 2 & sleep 4 & seq 1000000 >/dev/null & wait"
30849       sleep   0.000   0.000   1.503   7581696 368640  7581696.0       368640.0        /home/zhanxw/mycode/bench       "sleep 2"
30850       sleep   0.000   0.000   3.506   7581696 368640  7581696.0       368640.0        /home/zhanxw/mycode/bench       "sleep 4"
30846       python  0.000   0.000   4.508   155717632       7516160 86151689.6624   7192939.64679   /home/zhanxw/mycode/bench       "/home/zhanxw/python27/bin/python /home/zhanxw/bin/monitor.py -s -i 0.5 sleep 2 & sleep 4 & seq 1000000 >/dev/null & wait"
0.60u 0.00s 4.01r (rss)1613kb 0 /bin/sh -c sleep 2 & sleep 4 & seq 1000000 >/dev/null & wait
Example 3: generate benmarking metrics and graphs to external file
- ::
> monitor.py -t -o burnCpu.mon -g ./burnCpu 6.22u 0.01s 6.25r (rss)1565kb 0 ./burnCpu
Result are stored in burnCpu.mon, burnCpu.mon.trace.cpu, burnCpu.mon.trace.mem and burnCpu.mon.png.
burnCpu.mon content
PID Prog    UsrTime SysTime RealTime        MaxVms  MaxRss  AvgVms  AvgRss  Path    Command
29900       burnCpu 7.480   0.000   7.532   12730368        839680  12730368.0      839680.0        /home/zhanxw/mycode/bench       "./burnCpu"
29898       python  0.000   0.000   7.732   78807040        7118848 76893692.4593   7018742.03273   /home/zhanxw/mycode/bench       "/home/zhanxw/python27/bin/python /home/zhanxw/bin/monitor.py -t -o burnCpu.mon -g ./burnCpu"
burnCpu.mon.trace.cpu content
PID Prog    UsrTime SysTime RealTime
29900       burnCpu 0.06    0.0     1381423522.56
29900       burnCpu 0.16    0.0     1381423522.66
29900       burnCpu 0.26    0.0     1381423522.76
29900       burnCpu 0.36    0.0     1381423522.86
29900       burnCpu 0.46    0.0     1381423522.96
29900       burnCpu 0.56    0.0     1381423523.06
...
burnCpu.mon.trace.mem content
PID Prog    Time    VMS     RSS
29900       burnCpu 1381423522.56   12730368        839680
29900       burnCpu 1381423522.66   12730368        839680
29900       burnCpu 1381423522.76   12730368        839680
29900       burnCpu 1381423522.86   12730368        839680
29900       burnCpu 1381423522.96   12730368        839680
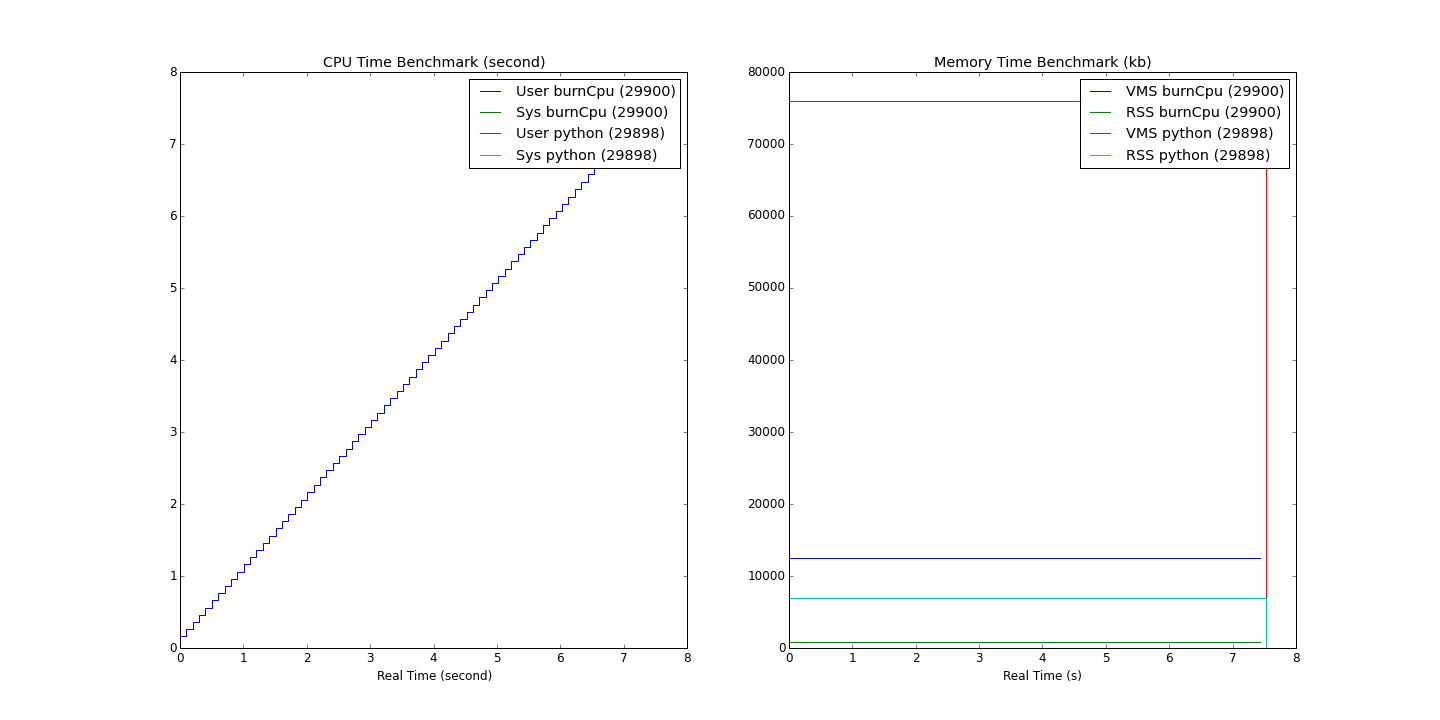
burnCpu.mon.png graph
NOTE
Implementation details: python will spawn monitor processes to collect runtime resources usage details. There are two types of monitor process: (1) a main monitor process will spawn user specified command, call waitpid() until the spawned process finishes; (2) other montiro process will monitor the command process and its child processes. Both monitor process will collect resource usages and put them in a process safe queue, in which usage statistics are calculuated or saved.
Option -s will use shell (/bin/sh) to execute commands. It’s a convenient feature but comes with some shell exploit hazards.
bench requires psutil to collect basic benchmarking metrics, and requires numpy and matplotlib to generate benchmark graphs.
Contact
Xiaowei Zhan<zhanxw[at]gmail.com>
Release history Release notifications | RSS feed


Download files
Download the file for your platform. If you're not sure which to choose, learn more about installing packages.


