"Profiler for buildbot master and its UI"


Project description
This plugin implements a profiler for buildbot master.
It uses statistical profiling loosely based on plop https://github.com/bdarnell/plop
Suitable for prod as statistical profiling is very low overhead
Profiles all threads including main thread and db threads
Removes noise samples when the threads are actually in the main loop
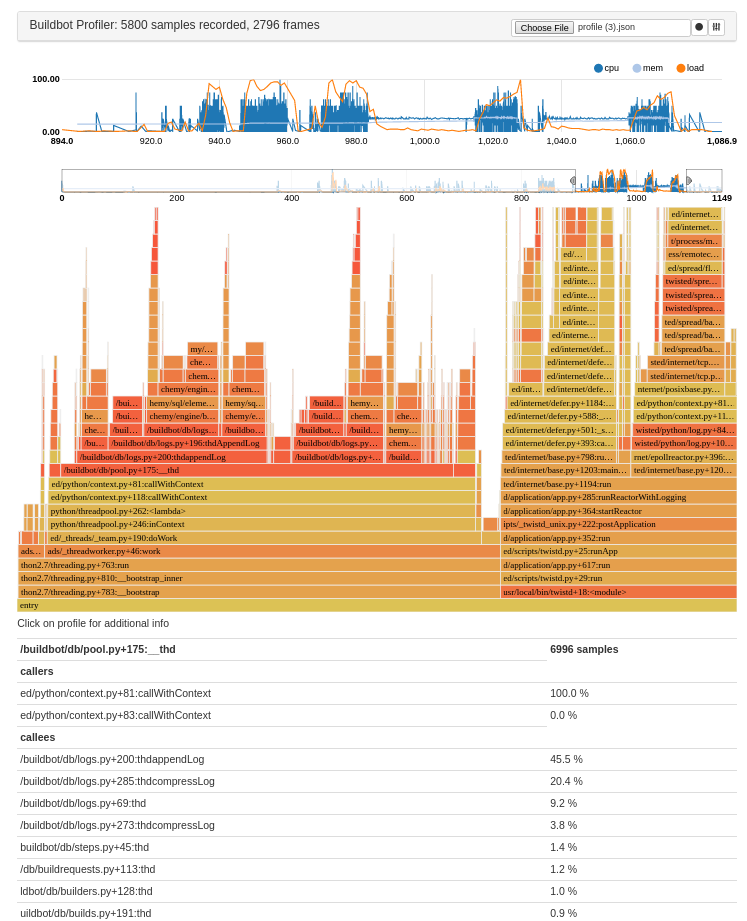
In-browser UI based on nvd3 and d3-flame-graph
Show cpu and memory percent over time
flame graph can be restricted to a subset of the trace
Detailed caller/callee are displayed when clicking on a function
Usage
installation:
pip install buildbot_profilerthen in master.cfg:
c['www']['plugins']['profiler'] = TrueAlternatively, you can install it in service mode, without the UI
c['services'] = [util.ProfilerService()]ProfilerService takes following arguments:
ProfilerService(frequency=100, gatherperiod=30 * 60, mode='virtual', basepath=None, wantBuilds=100)frequency: the profiling frequency in HZ. Not that if there is no activity during a profiling timer, no data will be recorded.
gatherperiod: the period during which the profiler works on one file. By default a new json file is created every 30min with the profile of the last 30min. Note that if there is no activity the gather period might be longer.
mode: profiling timer to use. Can be:
prof: use SIG_PROF timer,
virtual: use SIGVTALRM timer,
real: use SIGALRM timer,
basepath: the base path where to store the json files. (defaults to (master's basedir)/prof_)
wantBuilds: if this is > 0 then the last N builds are stored along side the profile data, for debug purpose.
Standalone Viewer
A standalone viewer is provided for offline browse of user submitted profiles.
bbprofilerThen you can open your browser on http://localhost:8080
Screenshot
ChangeLog
1.3.1 Upgrade build to webpack, Fix argument parsing for record duration and sample rate
1.2.3 Fixes for python2
1.2.2 Fixes for python3
1.2.1 Fix issues with load calculation
- 1.2.0 Fold the flames so that you can explore larger traces.
Fix the service so that the trace is reset between run.
1.1.0 add a service to use the profiler without bother the users with a profiler UI.
1.0.0 initial version


