A general purpose GUI application used to analyze chiplots.

Project description
Chiplot Analyze is a general purpose GUI application used to split chiplots from peak reflections, Subtract the background using a smoothed convex hull and analyze peaks using the trapezoidal rule.
To run the program start it from the command line as follows “chiplot-analyze [-d -c <center error range in float format> -z <smallest zoom range in pixels> -b <base movement per keystroke in float format> -s <width in pixels,height in pixels(no spaces)>”, follow the prompts below the graph display as shown below:
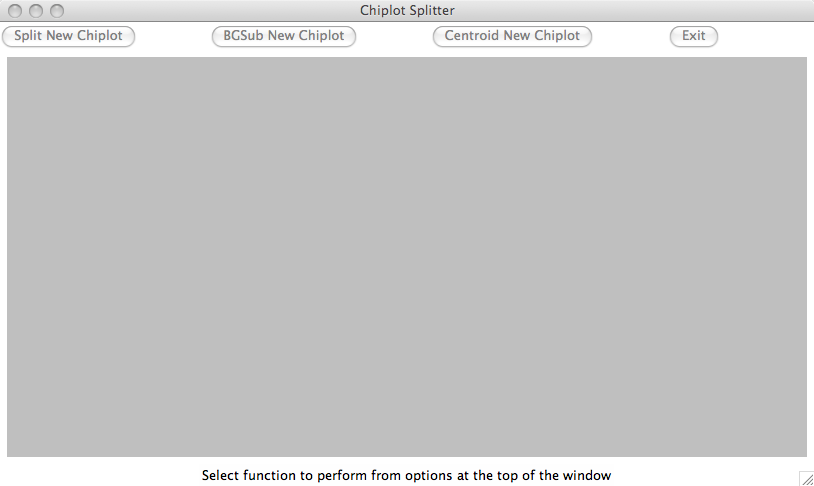
As describe above, there are three routines that this application can accomplish, these are selectable from the buttons at the top of the window, these are available at all times, you can easily switch between any at all times. After selecting one of the functions you will be prompted for an input file to work with, there are conventions to filenames, however this program will work any file correctly formatted. Each routine is described below.
Splitter (split):
This routine is used to split chiplots using pairs of reflection peaks within the chiplot. The input for this program is a space delimitated set of evenly spaced points. The program is preprimed and ready for input as soon as the user has selected a chiplot. Following onscreen instructions the user is to set the number of reflections used in the splitting routine, along with a checkbox marking it to have a valid center peak. Once done, upper and lower bounds for each of the peaks are to be selected, the program only uses the x coordinates of the clicks, so it is not necessary to accurately click. Once the required peaks have been set, the routine will automagically split it and display the peaks discovered and mark the center of the chiplot with a green line. The algorithm checks for the range of centers calculated from the peaks for accuracy. This accuracyrange is set when starting the program from the command line, see above for starting details. When done, it will prompt the user to save the split chiplots using filenames specified. If the graph is not split correctly, select redo and re-split the chiplot. When the center is correctly identified, output the chiplots using standard or custom filenames. It is convention to label the split files by adding ʻl.xyʼ and ʻr.xyʼ to the left and right split files respectively.
Background Subtraction (BGSub):
This routine is used to subtract the background from supplied chiplots using a convex hull that is optionally smoothed by a variety of interpolating functions. The input for this program is a space delimitated set of evenly spaced points. Following the onscreen instructions the user will give left and right bounds on the region of the plot that will be used to generate a background function. A vertical red line will appear on the screen wherever the user clicks, indicating the cutoff points for the interpolation. Once these have been successfully set the user has the option to ignore parts of the graph that have large negative peaks which would mess up the convex hull algorithm. By selecting eliminate peaks, the user then selects to the left and right of each peak, order is important. These areas will be ignored by the convex hull algorithm. When all such points have been marked, Select Convex Hull from the commands below the prompt to run the convex hull algorithm. If the algorithm is not successful or a large negative peak was missed, simply reset the current chiplot and try again. When the Convex hull is correct, you can output these values into a non uniform chiplot, which is usually denoted by a ʻ.hullʼ. From here optionally smooth the convex hull points using a variety of interpolating functions selected by radio buttons below the command buttons. There are currently two options Spline fitting curves and Pchip Curves. When a reasonable curve has been set, or the convex hull is what is wanted, run the subtraction routine from the commands below the prompt. This will subtract the background and output the data to the place you choose. It is convention to add .bak to these files as the standard files indicate.
Peak Analysis (Centroid):
This routine is used to analyze peaks from the supplied chiplots using a trapezoid area integrating function and a determine the center of the peak by finding its centroid. The input for this program is a space delimitated set of evenly spaced points. Following the onscreen instructions the user is prompted to select a log file to output the peak data to. The logfile is appended to so there is no worry about overwriting old data, and you can simply select the same log file for the entire data set to make it work wonders. This point is not clear from the onscreen instructions as it prompts you that it will overwrite the old file, it is ok to output to more than one file, however unnecessary. Once the output file has been selected, the user is left to pick a function to perform. A zoom function or an analyzation function. The zoom function is acomplished by a dragging a box on the screen, it is fairly laggy and may be changed soon, however it works, thus two lines are drug across the screen to zoom into that region. Once done, the user can select Analyze from the commands below the prompt. When selected, the user moves the baseline which is provided (the green line on the picture) by the arrow keys or manually setting it in the text box below the prompt. When the baseline hasbeen set, the upper and lower bounds of the peak are determined by user input on either side of the peak. When done, select run analyze from the commands to determine the centroid and area of the peak, these are displayed on screen and written to the log file. To run an analyzation on another peak from the same file, simply ʻreset (analyze new peak)ʼ the graph and repeat the above instructions.
Release history Release notifications | RSS feed


Download files
Download the file for your platform. If you're not sure which to choose, learn more about installing packages.
Source Distribution
Built Distribution
Hashes for chiplot_analyze-0.9.7-py2-none-any.whl
| Algorithm | Hash digest | |
|---|---|---|
| SHA256 | 6d6aa902bf570635dc1831ecb1c602b8c2553dcf7c22b155fecbc065f2f1b5f5 |
|
| MD5 | 75b990b2909a81854f6d43a2bcc45a96 |
|
| BLAKE2b-256 | df5fb52e1fc3dbdefbb074e4fd1fda4eeabf5d9b1057c5338779ea7882771ff0 |


