Make some beautiful corner plots of samples.

Project description
Make some beautiful corner plots.
- Corner plot /ˈkôrnər plät/ (noun):
An illustrative representation of different projections of samples in high dimensional spaces. It is awesome. I promise.
Built by Dan Foreman-Mackey and collaborators (see corner.__contributors__ for the most up to date list). Licensed under the 2-clause BSD license (see LICENSE).
Installation
Just run
pip install corner
to get the most recent stable version.
Usage
The main entry point is the corner.corner function. You’ll just use it like this:
import numpy as np
import corner

ndim, nsamples = 5, 10000
samples = np.random.randn(ndim * nsamples).reshape([nsamples, ndim])
figure = corner.corner(samples)
figure.savefig("corner.png")
With some other tweaks (see demo.py) you can get something that looks awesome like:
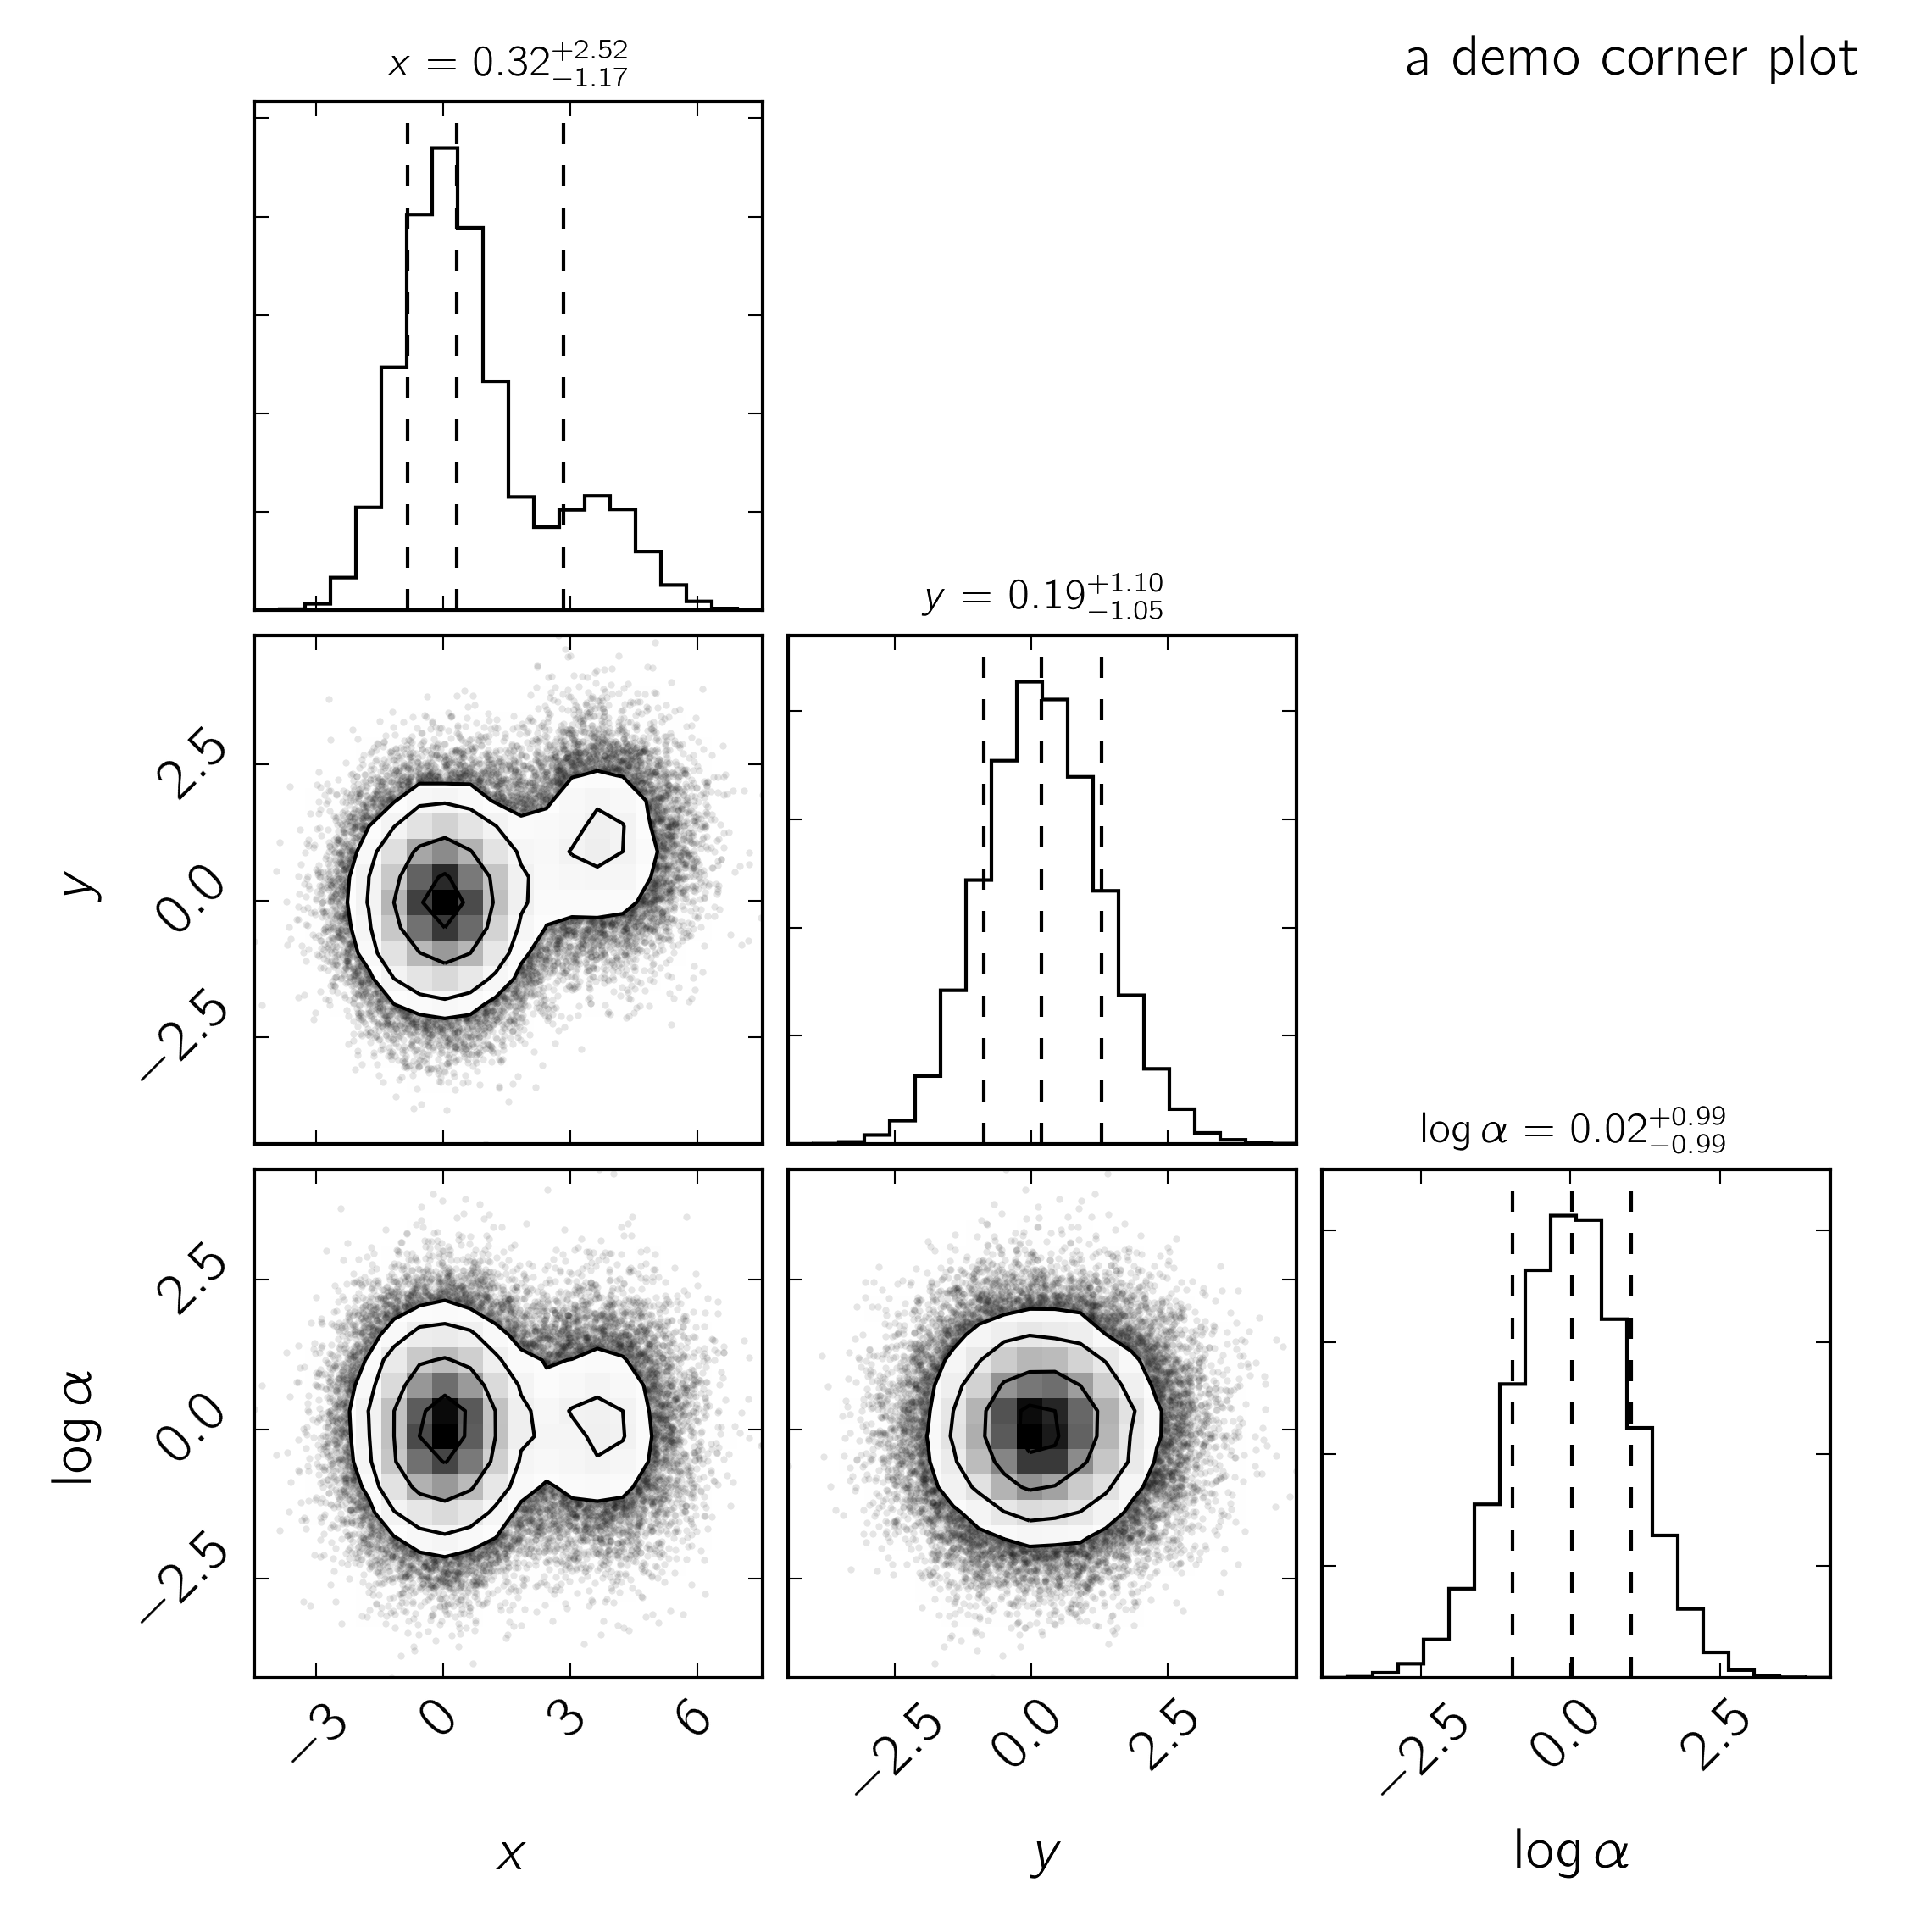
By default, data points are shown as grayscale points with contours. Contours are shown at 0.5, 1, 1.5, and 2 sigma.
Attribution

If you make use of this code, please cite it.
License
Copyright 2013, 2014 Dan Foreman-Mackey
corner.py is free software made available under the BSD License. For details see the LICENSE file.
Release history Release notifications | RSS feed


Download files
Download the file for your platform. If you're not sure which to choose, learn more about installing packages.


