Use geometric objects as matplotlib paths and patches

Project description
Use Shapely or GeoJSON-like geometric objects as matplotlib paths and patches
Requires: matplotlib, numpy, and optionally Shapely 1.2+.
Example:
from matplotlib import pyplot
from shapely.geometry import LineString
from descartes import PolygonPatch
BLUE = '#6699cc'
GRAY = '#999999'
def plot_line(ax, ob):
x, y = ob.xy
ax.plot(x, y, color=GRAY, linewidth=3, solid_capstyle='round', zorder=1)
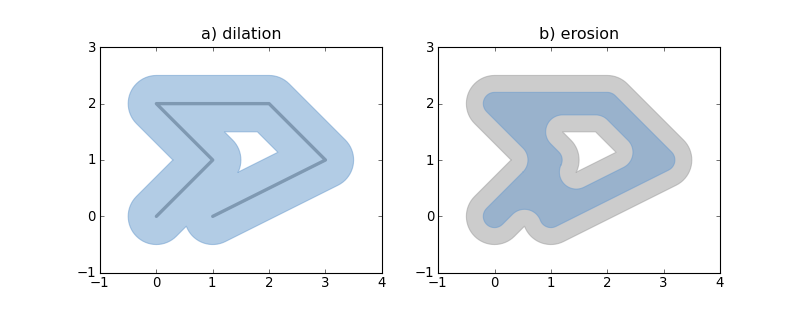
line = LineString([(0, 0), (1, 1), (0, 2), (2, 2), (3, 1), (1, 0)])
fig = pyplot.figure(1, figsize=(10, 4), dpi=180)
# 1
ax = fig.add_subplot(121)
plot_line(ax, line)
dilated = line.buffer(0.5)
patch1 = PolygonPatch(dilated, fc=BLUE, ec=BLUE, alpha=0.5, zorder=2)
ax.add_patch(patch1)
#2
ax = fig.add_subplot(122)
patch2a = PolygonPatch(dilated, fc=GRAY, ec=GRAY, alpha=0.5, zorder=1)
ax.add_patch(patch2a)
eroded = dilated.buffer(-0.3)
# GeoJSON-like data works as well
polygon = eroded.__geo_interface__
# >>> geo['type']
# 'Polygon'
# >>> geo['coordinates'][0][:2]
# ((0.50502525316941682, 0.78786796564403572), (0.5247963548222736, 0.8096820147509064))
patch2b = PolygonPatch(polygon, fc=BLUE, ec=BLUE, alpha=0.5, zorder=2)
ax.add_patch(patch2b)
pyplot.show()
See also: examples/patches.py.
Descartes is not associated with the identically named and apparently defunct project at http://descartes.sourceforge.net/.


