Displays template rendering time on the timeline


Project description

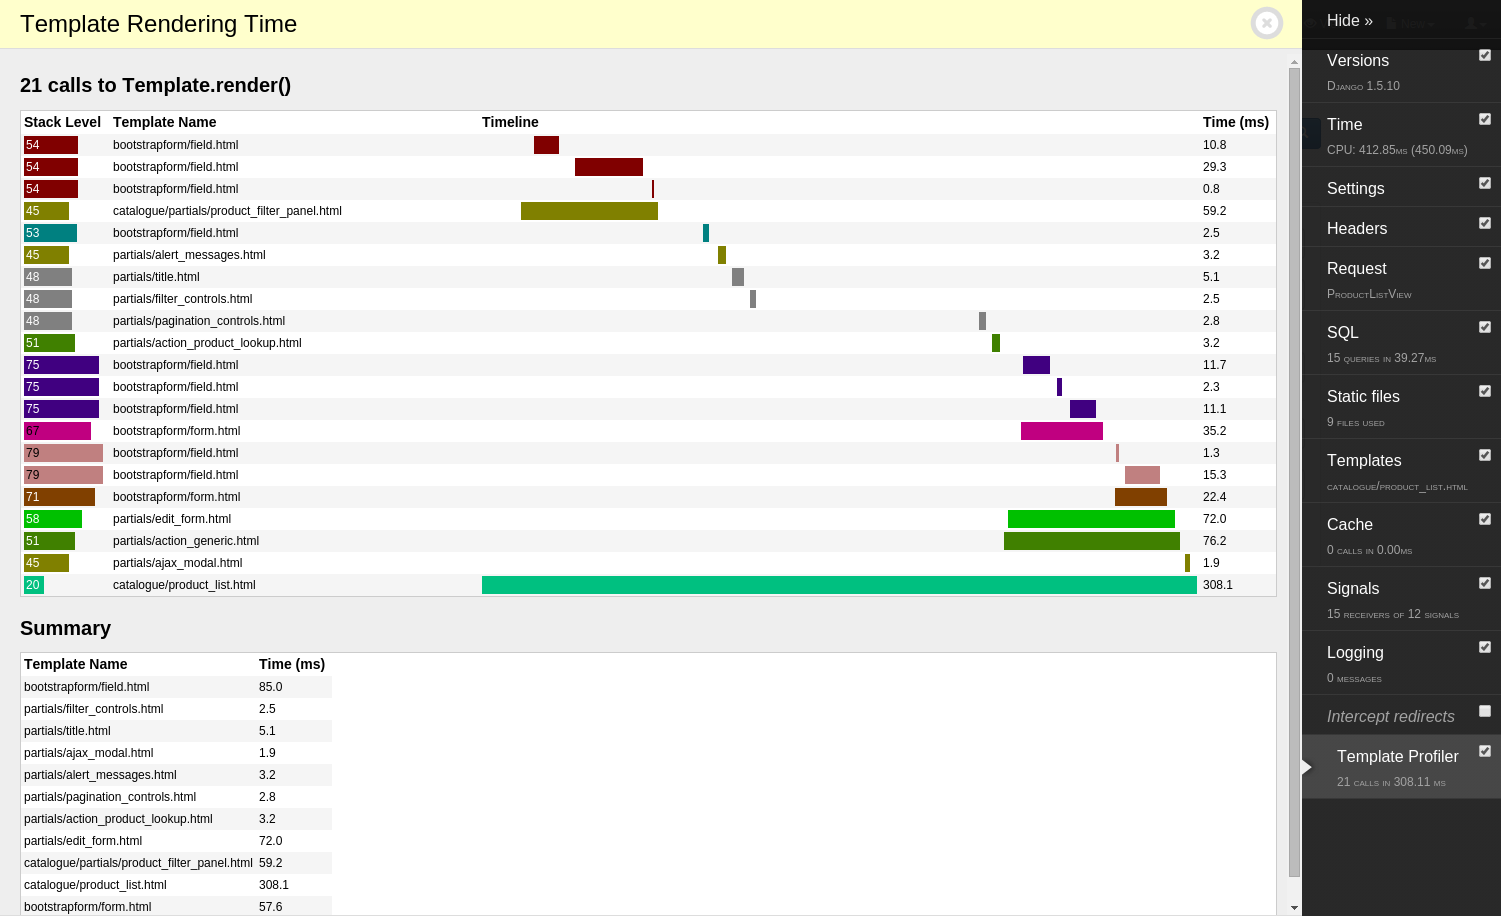
An extra panel for django-debug-toolbar that displays time spent rendering each template.
For example:
Installation
First, you’ll need to install and configure django-debug-toolbar as per its installation instructions.
Second, install this package:
pip install django-debug-toolbar-template-profilerThird, add it to your installed apps - order doesn’t matter but after debug_toolbar will keep it neatly grouped:
INSTALLED_APPS = [
    # ...
    "debug_toolbar",
    "template_profiler_panel",
    # ...
]
Fourth, configure django-debug-toolbar’s DEBUG_TOOLBAR_PANELS setting as per its documentation to include the panel. You’ll need to copy the default and add the panel at the end:
DEBUG_TOOLBAR_PANELS = [
    # ...
    "template_profiler_panel.panels.template.TemplateProfilerPanel",
]
After this, you should see the “Template Profiler” panel when you load the toolbar. Both Django and Jinja2 template render() calls will be measured.


Download files
Download the file for your platform. If you're not sure which to choose, learn more about installing packages.
Source Distribution
Built Distribution
Hashes for django-debug-toolbar-template-profiler-2.1.0.tar.gz
| Algorithm | Hash digest | |
|---|---|---|
| SHA256 | 740d4fa90f9c72fe97c896d5a395abc535cf8e9d571c1710186aa775a861d7f4 |
|
| MD5 | b0155da9d860ec34ab6ff264ad904638 |
|
| BLAKE2b-256 | 630a5db0aca31dac95fadd63597f51ca082a3ae1b1bb2468858ab899aac4227b |
Hashes for django_debug_toolbar_template_profiler-2.1.0-py2.py3-none-any.whl
| Algorithm | Hash digest | |
|---|---|---|
| SHA256 | 7c77b3d96a0f64a47ed80dec88bad0832fe2834d17da5cd77f86639680b56a8b |
|
| MD5 | f4663918f7a0e6382f532954473e31bb |
|
| BLAKE2b-256 | 8a764e24fab1e9f07610edfaf434614ae94ea7e0a5cfd9ab586a78f803ac397d |


