Make beautiful maps with Leaflet.js & Python


Project description


Folium

Python Data. Leaflet.js Maps.
Folium builds on the data wrangling strengths of the Python ecosystem and the mapping strengths of the Leaflet.js library. Manipulate your data in Python, then visualize it in on a Leaflet map via Folium.
Concept
Folium makes it easy to visualize data that’s been manipulated in Python on an interactive Leaflet map. It enables both the binding of data to a map for choropleth visualizations as well as passing Vincent/Vega visualizations as markers on the map.
The library has a number of built-in tilesets from OpenStreetMap, MapQuest Open, MapQuest Open Aerial, Mapbox, and Stamen, and supports custom tilesets with Mapbox or Cloudmade API keys. Folium supports both GeoJSON and TopoJSON overlays, as well as the binding of data to those overlays to create choropleth maps with color-brewer color schemes.
Installation
$ pip install foliumGetting Started
To create a base map, simply pass your starting coordinates to Folium:
import folium
map_osm = folium.Map(location=[45.5236, -122.6750])
map_osm.create_map(path='osm.html')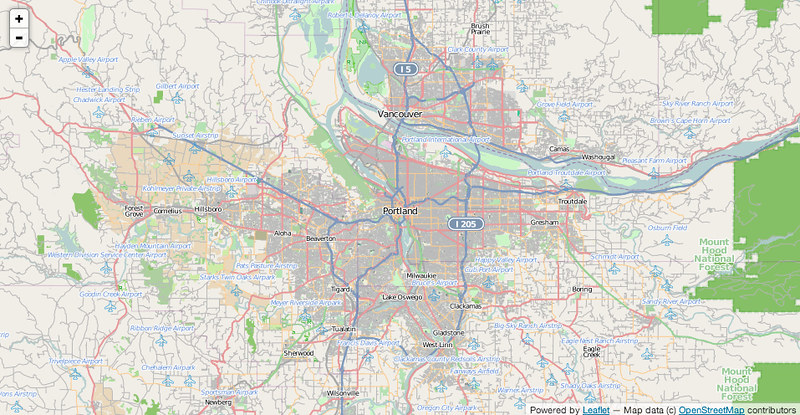
stamen = folium.Map(location=[45.5236, -122.6750], tiles='Stamen Toner',
                    zoom_start=13)
stamen.create_map(path='stamen_toner.html')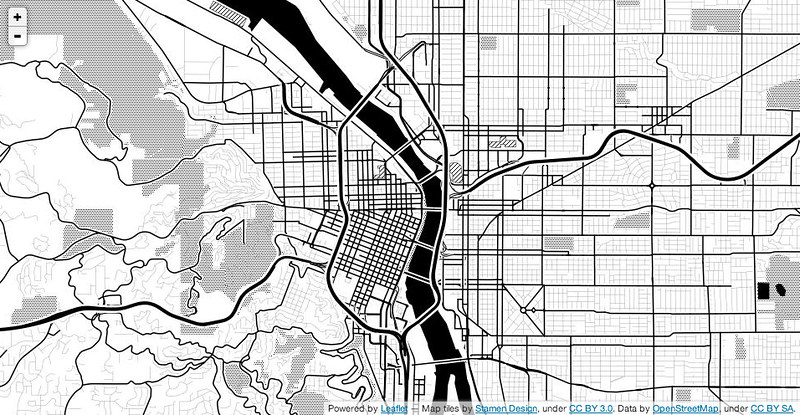
Folium also supports Cloudmade and Mapbox custom tilesets- simply pass your key to the API_key keyword:
custom = folium.Map(location=[45.5236, -122.6750], tiles='Mapbox',
                    API_key='wrobstory.map-12345678')
Lastly, Folium supports passing any Leaflet.js compatible custom tileset:
tileset = r'http://{s}.tiles.yourtiles.com/{z}/{x}/{y}.png'
map = folium.Map(location=[45.372, -121.6972], zoom_start=12,
                 tiles=tileset, attr='My Data Attribution')
Markers
map_1 = folium.Map(location=[45.372, -121.6972], zoom_start=12,
                   tiles='Stamen Terrain')
map_1.simple_marker([45.3288, -121.6625], popup='Mt. Hood Meadows')
map_1.simple_marker([45.3311, -121.7113], popup='Timberline Lodge')
map_1.create_map(path='mthood.html')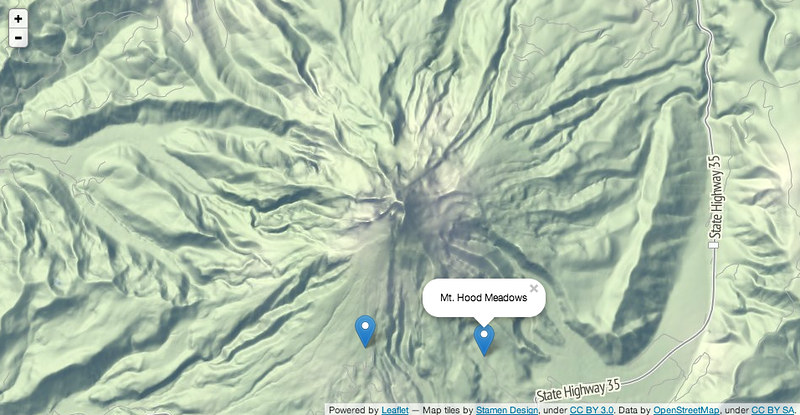
Folium supports colors and marker icon types (from bootstrap)
map_1 = folium.Map(location=[45.372, -121.6972], zoom_start=12,tiles='Stamen Terrain')
map_1.simple_marker([45.3288, -121.6625], popup='Mt. Hood Meadows',marker_icon='cloud')
map_1.simple_marker([45.3311, -121.7113], popup='Timberline Lodge',marker_color='green')
map_1.simple_marker([45.3300, -121.6823], popup='Some Other Location',marker_color='red',marker_icon='info-sign')
map_1.create_map(path='iconTest.html')
Folium also supports circle-style markers, with custom size and color:
map_2 = folium.Map(location=[45.5236, -122.6750], tiles='Stamen Toner',
                   zoom_start=13)
map_2.simple_marker(location=[45.5244, -122.6699], popup='The Waterfront')
map_2.circle_marker(location=[45.5215, -122.6261], radius=500,
                    popup='Laurelhurst Park', line_color='#3186cc',
                    fill_color='#3186cc')
map_2.create_map(path='portland.html')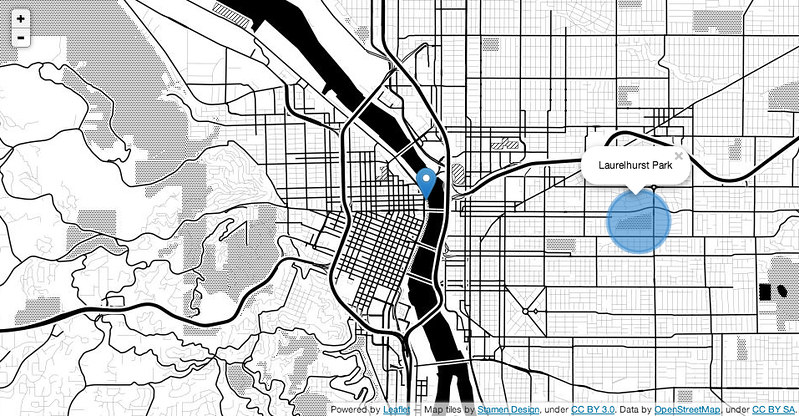
Folium has a convenience function to enable lat/lng popovers:
map_3 = folium.Map(location=[46.1991, -122.1889], tiles='Stamen Terrain',
                   zoom_start=13)
map_3.lat_lng_popover()
map_3.create_map(path='sthelens.html')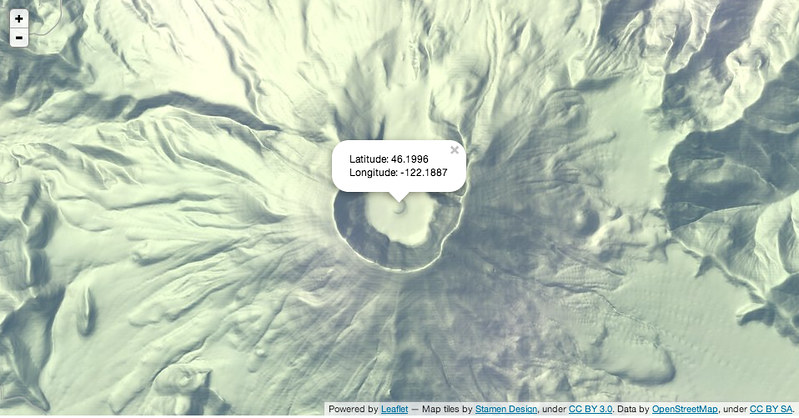
Click-for-marker functionality will allow for on-the-fly placement of markers:
map_4 = folium.Map(location=[46.8527, -121.7649], tiles='Stamen Terrain',
                   zoom_start=13)
map_4.simple_marker(location=[46.8354, -121.7325], popup='Camp Muir')
map_4.click_for_marker(popup='Waypoint')
map_4.create_map(path='mtrainier.html')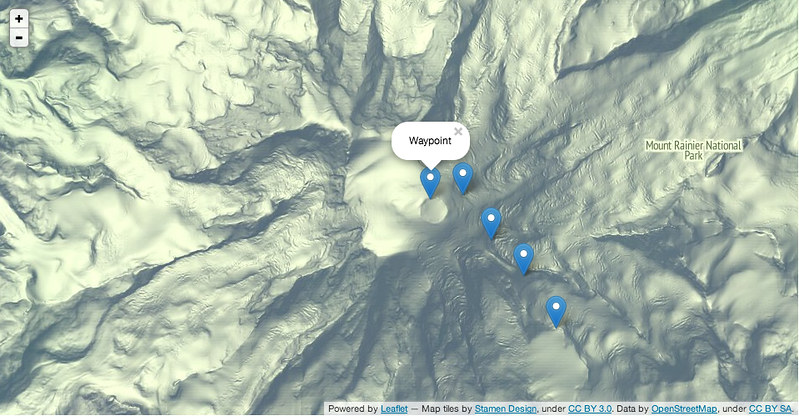
Folium also supports the Polygon marker set from the Leaflet-DVF:
map_5 = folium.Map(location=[45.5236, -122.6750], zoom_start=13)
map_5.polygon_marker(location=[45.5012, -122.6655], popup='Ross Island Bridge',
                     fill_color='#132b5e', num_sides=3, radius=10)
map_5.polygon_marker(location=[45.5132, -122.6708], popup='Hawthorne Bridge',
                     fill_color='#45647d', num_sides=4, radius=10)
map_5.polygon_marker(location=[45.5275, -122.6692], popup='Steel Bridge',
                     fill_color='#769d96', num_sides=6, radius=10)
map_5.polygon_marker(location=[45.5318, -122.6745], popup='Broadway Bridge',
                     fill_color='#769d96', num_sides=8, radius=10)
map_5.create_map(path='bridges.html')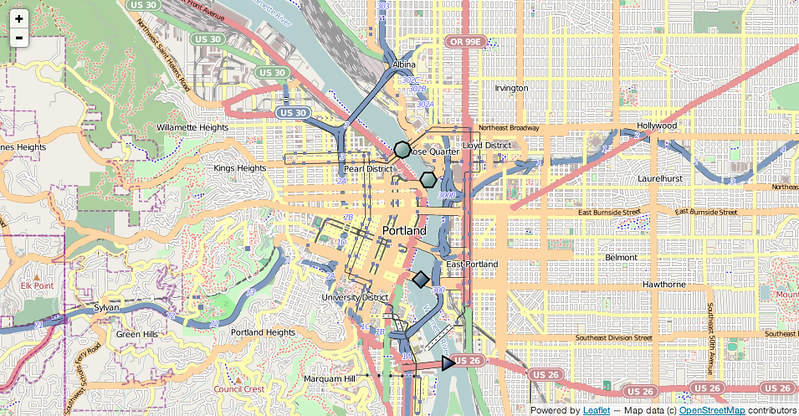
Vincent/Vega Markers
Folium enables passing vincent visualizations to any marker type, with the visualization as the popover:
buoy_map = folium.Map(location=[46.3014, -123.7390], zoom_start=7,
                      tiles='Stamen Terrain')
buoy_map.polygon_marker(location=[47.3489, -124.708], fill_color='#43d9de',
                        radius=12, popup=(vis1, 'vis1.json'))
buoy_map.polygon_marker(location=[44.639, -124.5339], fill_color='#43d9de',
                        radius=12, popup=(vis2, 'vis2.json'))
buoy_map.polygon_marker(location=[46.216, -124.1280], fill_color='#43d9de',
                        radius=12, popup=(vis3, 'vis3.json'))
buoy_map.create_map(path='NOAA_buoys.html')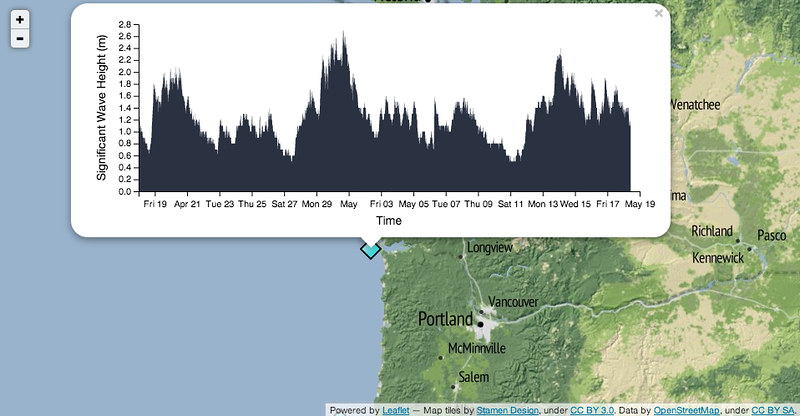
GeoJSON/TopoJSON Overlays
Both GeoJSON and TopoJSON layers can be passed to the map as an overlay, and multiple layers can be visualized on the same map:
geo_path = r'data/antarctic_ice_edge.json'
topo_path = r'data/antarctic_ice_shelf_topo.json'

ice_map = folium.Map(location=[-59.1759, -11.6016],
                   tiles='Mapbox Bright', zoom_start=2)
ice_map.geo_json(geo_path=geo_path)
ice_map.geo_json(geo_path=topo_path, topojson='objects.antarctic_ice_shelf')
ice_map.create_map(path='ice_map.html')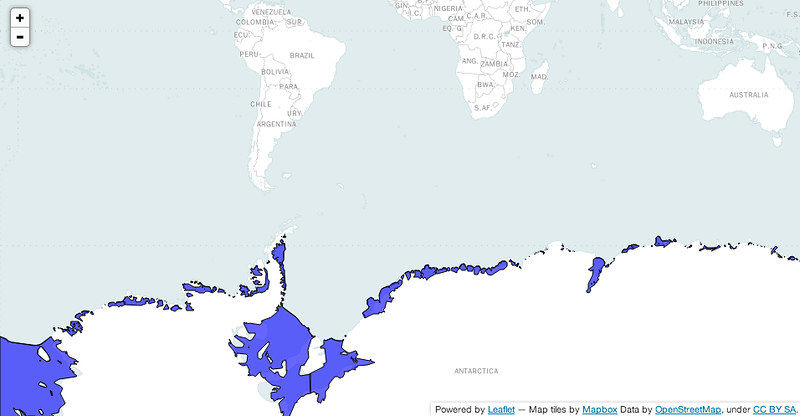
Choropleth Maps
Folium allows for the binding of data between Pandas DataFrames/Series and Geo/TopoJSON geometries. Color Brewer sequential color schemes are built-in to the library, and can be passed to quickly visualize different combinations:
import folium
import pandas as pd

state_geo = r'data/us-states.json'
state_unemployment = r'data/US_Unemployment_Oct2012.csv'

state_data = pd.read_csv(state_unemployment)

#Let Folium determine the scale
map = folium.Map(location=[48, -102], zoom_start=3)
map.geo_json(geo_path=state_geo, data=state_data,
             columns=['State', 'Unemployment'],
             key_on='feature.id',
             fill_color='YlGn', fill_opacity=0.7, line_opacity=0.2,
             legend_name='Unemployment Rate (%)')
map.create_map(path='us_states.html')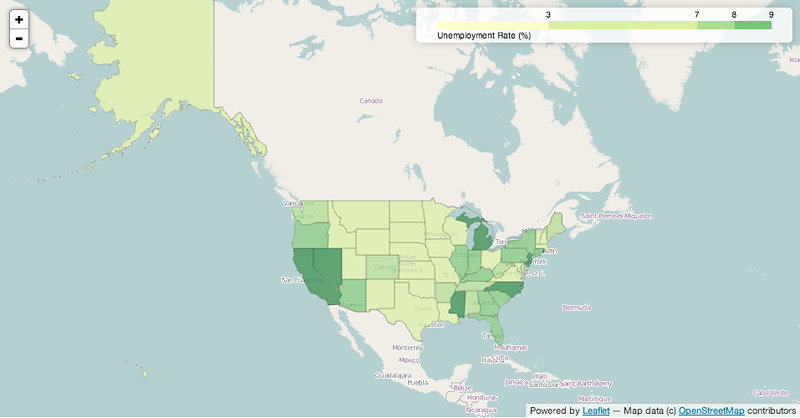
Folium creates the legend on the upper right based on a D3 threshold scale, and makes the best-guess at values via quantiles. Passing your own threshold values is simple:
map.geo_json(geo_path=state_geo, data=state_data,
             columns=['State', 'Unemployment'],
             threshold_scale=[5, 6, 7, 8, 9, 10],
             key_on='feature.id',
             fill_color='BuPu', fill_opacity=0.7, line_opacity=0.5,
             legend_name='Unemployment Rate (%)',
             reset=True)
map.create_map(path='us_states.html')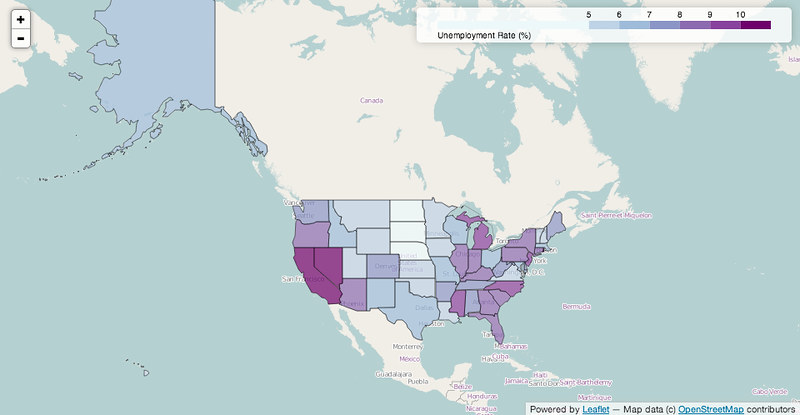
By binding data via the Pandas DataFrame, different datasets can be quickly visualized. In the following example, the df DataFrame contains six columns with different economic data, a few of which we will visualize:
#Number of employed with auto scale
map_1 = folium.Map(location=[48, -102], zoom_start=3)
map_1.geo_json(geo_path=county_geo, data_out='data1.json', data=df,
               columns=['GEO_ID', 'Employed_2011'],
               key_on='feature.id',
               fill_color='YlOrRd', fill_opacity=0.7, line_opacity=0.3,
               topojson='objects.us_counties_20m')
map_1.create_map(path='map_1.html')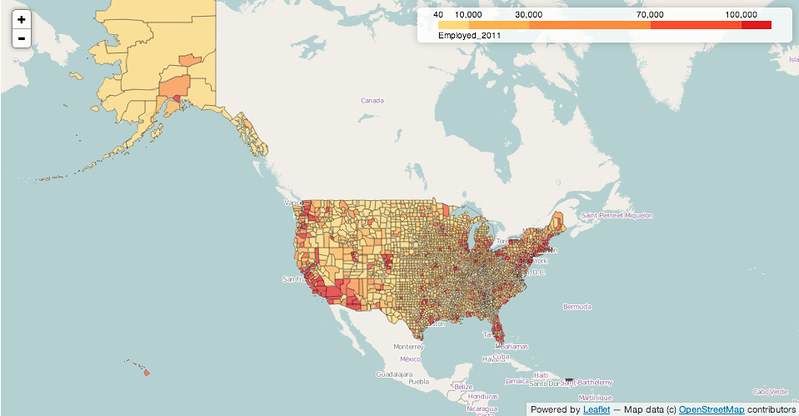
#Unemployment with custom defined scale
map_2 = folium.Map(location=[40, -99], zoom_start=4)
map_2.geo_json(geo_path=county_geo, data_out='data2.json', data=df,
               columns=['GEO_ID', 'Unemployment_rate_2011'],
               key_on='feature.id',
               threshold_scale=[0, 5, 7, 9, 11, 13],
               fill_color='YlGnBu', line_opacity=0.3,
               legend_name='Unemployment Rate 2011 (%)',
               topojson='objects.us_counties_20m')
map_2.create_map(path='map_2.html')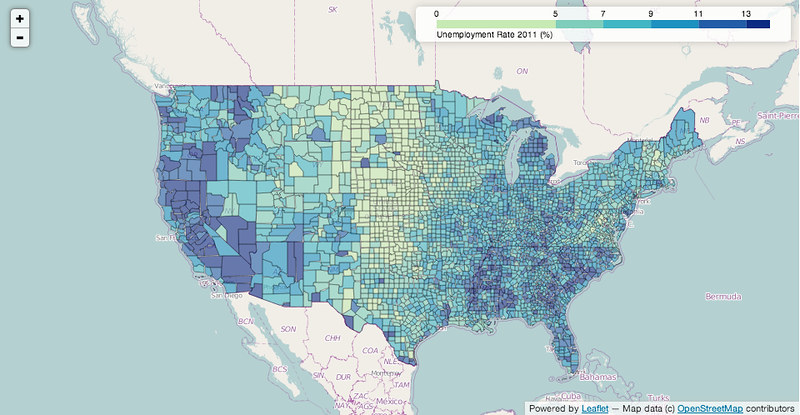
#Median Household income
map_3 = folium.Map(location=[40, -99], zoom_start=4)
map_3.geo_json(geo_path=county_geo, data_out='data3.json', data=df,
               columns=['GEO_ID', 'Median_Household_Income_2011'],
               key_on='feature.id',
               fill_color='PuRd', line_opacity=0.3,
               legend_name='Median Household Income 2011 ($)',
               topojson='objects.us_counties_20m')
map_3.create_map(path='map_3.html')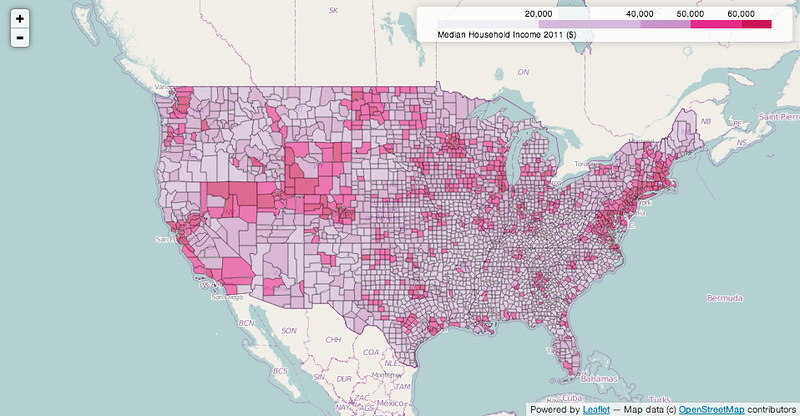
Dependencies
Jinja2
Pandas (Map Data Binding only)
Numpy (Map Data Binding only)
Vincent (Map Data Binding only)
Status
Beta
Docs
0.1.5
Popups on lines. (themiurgo)
Map auto bounds. (themiurgo)
GeoJSON popup. (ocefpaf 7aad5e0)
Added cartodb positron and dark_matter tiles (ocefpaf d4daee7)
Forcing HTTPS when available. (ocefpaf c69ac89)
Added Stamen Watercolor tiles. (ocefpaf 8c1f837)
Added non-pixel width and height. (ocefpaf a87a449)
Default map size is defined as non-pixel and equal to 100% of the window. (ocefpaf dcaf575)
Bug Fixes
Draw GeoJSON first. (ocefpaf d92bdbe)
Removed keyword unnecessary popup_on. (themiurgo 204d722)
Fixed MapQuest Open Aerial URL. (ocefpaf 5e787fa)
0.1.4
Popups allow unicode. (Anand Patil 545315a)
Loading javascript over https. (Anand Patil ac9a4d6)
Added width keyword to simple_popup. (ocefpaf 95325c4)
Support multi_polyline. (Younggun Kim efbd1db)
Added max and min zoom keywords. (ocefpaf 4ca4c92)
Bug Fixes
Remove margins from leaflet-tiles. (Lennart Fricke 3c11433)
Fix #50 template not found on Windows OSes. (ocefpaf 101daee)
Fixed add_wms_layer py3k bug. (ocefpaf 154f0a5)
0.1.3
Bootstrap glyphicon marker icons. @birdage
Cluster marker group, and simple markers . (birdage 801d91c)
WMS tile. (birdage 26f9668)
Expanded color support to 253 with colorbrewer. (Adam Pah 3ba39ae)
Port to python 3. (Pavel Tysliatski 5093e1b)
Update geojson_template to Leaflet.js 0.7. (Justin Duke a917551)
Update fol_template to Leaflet.js 0.7. (Justin Duke b328cec)
Add support for lines. (Jacob Wasserman e3be077)
Allow rendering w/ custom template. (Samat K Jain 1a85841)
MapQuest Open tilesets. (Samat K Jain d536949)
Bug Fixes
Vincent popups take padding into account. (Kyle Corbitt 26556fe)
Simple popups correctly escape internal quotes. (Kyle Corbitt 20c979f)
Add encoding specification. @jmduke
Reverted change to mathchColor. (Roy Keyes 70d7f5c)
Changed no-data fill to null/no-fill, rather than #fff. (Rob Story 6ff80a6)
Fixed issue with counties TopoJSON. (Rob Story cddaab3)
0.1.2
TopoJSON functionality. (Rob Story 5566b71)
Vincent/Vega charts as popups. (Rob Story 4b7e402)
GeoJSON overlays added. (Rob Story b5d9081)
Click to add markers, popover Lat/Lng functionality. (Rob Story 9c809f9)
Simple and Circle markers added. (Rob Story 181ac51)
Initial commit. (Rob Story 6a43874)
Release history Release notifications | RSS feed


Download files
Download the file for your platform. If you're not sure which to choose, learn more about installing packages.


