Location estimation using GSM Cells with Google Maps Geolocation API

Project description
The Google Maps Geolocation API actually lets you define multiple gsm cell towers into its request. But it will just return the location and accuracy based on the first cell(serving cell), doing nothing meaningful about the neighbour cells, rssi and timing advance values.
So this is an attempt to do something a bit more meaningful…
Installation
Use pip:
pip install geocell
Or clone the repo and:
pip setup.py install
Setting your Google Maps API Key
The key will be used in:
Google Maps Geolocation API for requesting cell locations
Google Maps Javascript API for drawing maps
If you don’t have a google maps api key. Go here and follow the instructions to get your key.
Set your api key using either of the following methods:
Set your key as the GOOGLE_MAPS_API_KEY environment variable
import geocell then geocell.api_key="<your api key>"
Usage
Simple location request
>>> import geocell
>>> sample_cell = {"mnc":2,"mcc":286,"cid":51861,"lac":54110}
>>> geocell.locate(sample_cell)
{'location': {'lat': 40.7018889, 'lng': 29.8912834}, 'accuracy': 3250.0}
Location Estimation
We need the rssi values and multiple cell information to make an estimation
>>> sample_cells = [
...     {"rssi":-82,"mnc":2,"mcc":286,"cid":51861,"lac":54110},
...     {"rssi":-85,"mnc":2,"mcc":286,"cid":16116,"lac":54110},
...     {"rssi":-93,"mnc":2,"mcc":286,"cid":0,"lac":54108},
...     {"rssi":-94,"mnc":2,"mcc":286,"cid":38344,"lac":54110},
...     {"rssi":-97,"mnc":2,"mcc":286,"cid":52555,"lac":54110},
...     {"rssi":-98,"mnc":2,"mcc":286,"cid":51857,"lac":54108},
...     {"rssi":-99,"mnc":2,"mcc":286,"cid":39684,"lac":54110}
... ]
>>> geocell.estimate(sample_cells)
{'location': {'lat': 40.70356939393244, 'lng': 29.88564243119295}, 'accuracy': 251.3839360809747}Let’s see it in action now:
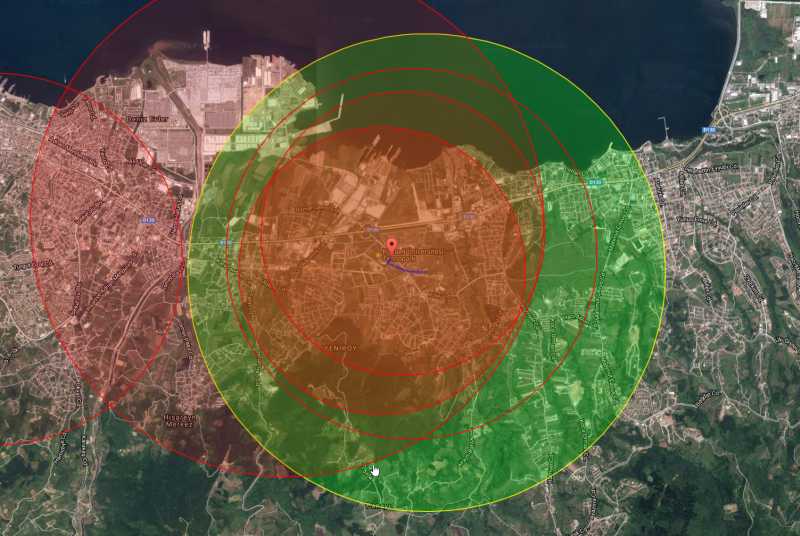
>>> geocell.estimate(sample_cells, "map.html")
{'location': {'lat': 40.70356939393244, 'lng': 29.88564243119295}, 'accuracy': 251.38393
60809747}
Looking at the generated map:
Light yellow circle is the serving cell
Red colored are the neighbour cells
The blue lines are the flight path showing estimation done at each step. Starting point of the flight path is the center of the serving cell
The marker shows the end of the flight path and the last estimated location
Let’s take a closer look:
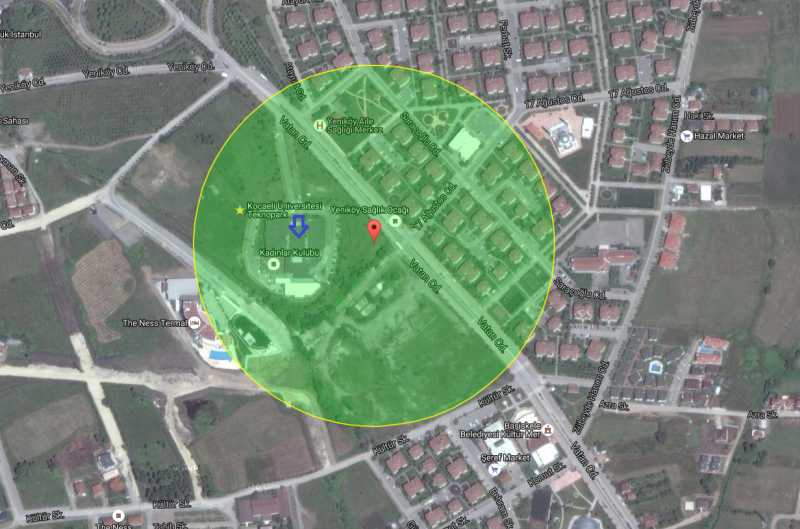
>>> geocell.estimate(sample_cells, "map_estimate.html", cell_display="estimate")
{'location': {'lat': 40.70356939393244, 'lng': 29.88564243119295}, 'accuracy': 251.38393
60809747}
Now the map shows only the estimated location(marker) and estimated accuracy(radius). The arrow points to the actual location.
Release history Release notifications | RSS feed

Download files
Download the file for your platform. If you're not sure which to choose, learn more about installing packages.


