Reads and (partially) writes seismic data in Landmark's Geoprobe format

Project description
python-geoprobe is a python module to read and write geoprobe horizons, volumes, and faults.
Notes
This implementation is based on reverse-engineering the file formats, and as such, is certainly not complete. However, things seem to work.
Examples
python-geoprobe supports basic reading and writing of geoprobe-formatted volumes, horizons, fault sticks, 2D seismic, colormaps, and TSurfs.
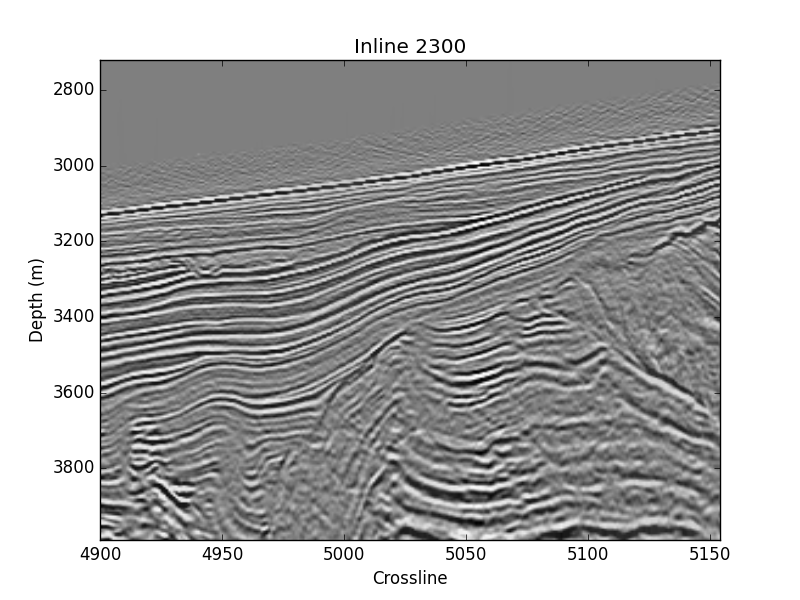
As an example of reading and display a slice from a volume:
import matplotlib.pyplot as plt
import geoprobe

vol = geoprobe.volume('examples/data/Volumes/example.vol')

# By default, this will not load the data into RAM. Instead,
# ``vol.data`` will be a memmapped numpy array
print vol.data

# Now let's load everythign into RAM. Note that ``vol.load()`` returns the
# array, but ``vol.data`` will be the same in-memory array after this, as well
vol.load()

# Indexing the volume works in "model" (inline/crossline/z) coordinates.
# We could also use ``vol.XSlice(2300)``, but indexing gives more flexibility.
data = vol[2300, :, :].T

# Display stretched. Note that for no vertical exaggeration, we'd use
# ``aspect=1/vol.dyW``
fig, ax = plt.subplots()
ax.imshow(data, cmap='gray_r', aspect='auto',
          extent=[vol.ymin, vol.ymax, vol.zmax, vol.zmin])
ax.set(title='Inline 2300', xlabel='Crossline', ylabel='Depth (m)')

plt.show()
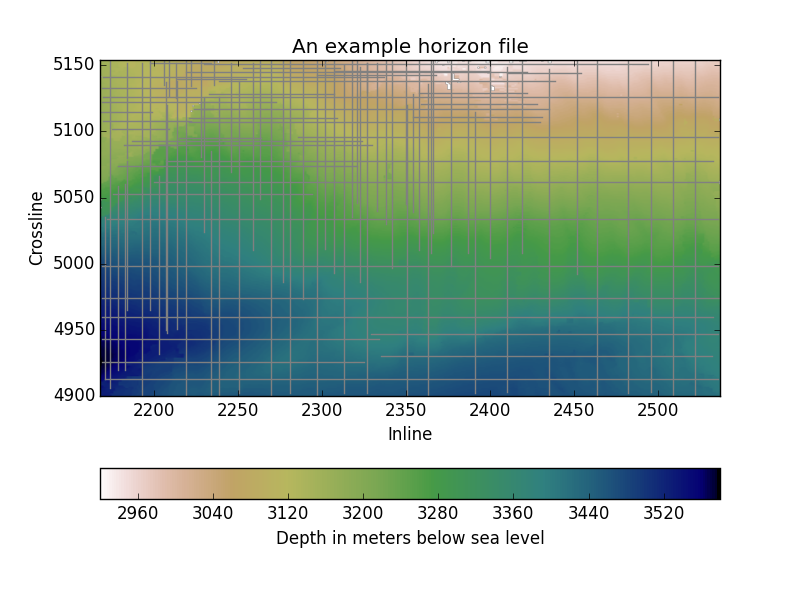
We can also read/write geoprobe-formatted binary horizons (ascii horizons currently not supported):
import matplotlib.pyplot as plt
import geoprobe

hor = geoprobe.horizon('examples/data/Horizons/channels.hzn')

# Some basic information about the horizon, to show useful attributes
print ('The horizon has a total of %i points, %i of which are'
       ' auto-tracked' % (hor.data.size, hor.surface.size))
print 'The horizon has %i manually picked lines' % len(hor.lines)
print 'The inline coordinates range from', hor.xmin, 'to', hor.xmax
print 'The crossline coordinates range from', hor.ymin, 'to', hor.ymax
print 'The depth/time coordinates range from', hor.zmin, 'to', hor.zmax

# Display the horizon:
fig, ax = plt.subplots()

# hor.grid is a 2D array of the Z-values stored in the horizon
im = ax.imshow(hor.grid, cmap='gist_earth_r', origin='lower',
               extent=(hor.xmin, hor.xmax, hor.ymin, hor.ymax))

# Plot the manual picks
# Here, "line" is a numpy structured array with fields 'x', 'y', 'z', etc.
# "line_info" is a 4-tuple of (xdir, ydir, zdir, ID) (and is unused here)
for line_info, line in hor.lines:
   ax.plot(line['x'], line['y'], color='gray')

# Other information...
cb = fig.colorbar(im, orientation='horizontal')
cb.set_label('Depth in meters below sea level')
ax.set(title='An example horizon file', xlabel='Inline', ylabel='Crossline')
ax.axis('tight')

plt.show()
Dependencies
Requires python >= 2.5 and numpy. Some functions (e.g. horizon.toGeotiff) require gdal and its python bindings. The plotting functions in utilities (e.g. utilities.wiggles) and some swfault functionality requires matplotlib.
Installation
Installation should be as simple as “python setup.py install”
Release history Release notifications | RSS feed


Download files
Download the file for your platform. If you're not sure which to choose, learn more about installing packages.


