Provide a matplotlib like interface to plotting data with Google Maps


Project description
Plotting data on Google Maps, the easy way. A matplotlib-like interface to generate the HTML and javascript to render all the data you’d like on top of Google Maps. Several plotting methods make creating exploratory map views effortless. Here’s a crash course:
import gmplot
gmap = gmplot.GoogleMapPlotter(37.428, -122.145, 16)
gmap.plot(latitudes, longitudes, 'cornflowerblue', edge_width=10)
gmap.scatter(more_lats, more_lngs, '#3B0B39', size=40, marker=False)
gmap.scatter(marker_lats, marker_lngs, 'k', marker=True)
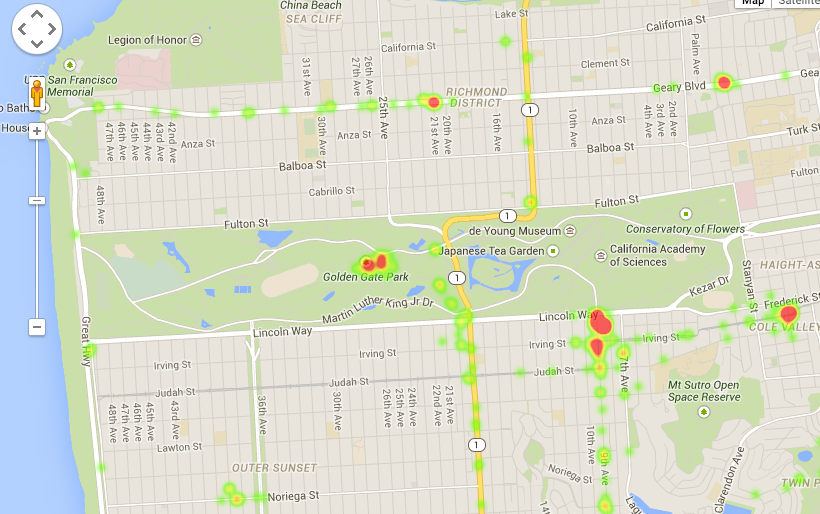
gmap.heatmap(heat_lats, heat_lngs)
gmap.draw("mymap.html")
Geocoding
gmplot contains a simple wrapper around Google’s geocoding service enabling map initilization to the location of your choice. Rather than providing latitude, longitude, and zoom level during initialization, grab your gmplot instance with a location:
gmap = gmplot.from_geocode("San Francisco")
Plot types
Polygons with fills.
Drop pins.
Scatter points.
Grid lines.
Heatmaps.
Misc.
Code hosted on GitHub
Install easily with pip install gmplot from PyPI.
Inspired by Yifei Jiang’s (jiangyifei@gmail.com) pygmaps module.
Release history Release notifications | RSS feed


Download files
Download the file for your platform. If you're not sure which to choose, learn more about installing packages.


