Artist for matplotlib to display a scale bar

Project description


Provides a new artist for matplotlib to display a scale bar, aka micron bar. It is particularly useful when displaying calibrated images plotted using plt.imshow(…).
The artist supports customization either directly from the ScaleBar object or from the matplotlibrc.
Installation
Easiest way to install using pip:
$ pip install matplotlib-scalebar
For development installation from the git repository:
$ git clone git@github.com:ppinard/matplotlib-scalebar.git
$ pip install -e matplotlib-scalebar
How to use
There are two modes of operation:
Length, value and units of the scale bar are automatically determined based on the specified pixel size dx and length_fraction. The value will only take the following numbers: 1, 2, 5, 10, 15, 20, 25, 50, 75, 100, 125, 150, 200, 500 or 750.
The desired value and units are specified by the user (fixed_value and fixed_units) and the length is calculated based on the specified pixel size dx.
The constructor arguments dx and units specify the pixel dimension. For example scalebar = ScaleBar(0.2, 'um') indicates that each pixel is equal to 0.2 micrometer. If the the axes image has already been calibrated by setting its extent, set dx to 1.0.
The system of units (SI, imperial, etc.) is defined by the argument dimension. By default, the scale bar uses SI units of length (e.g. m, cm, um, km, etc.). See examples below for other system of units.
Example
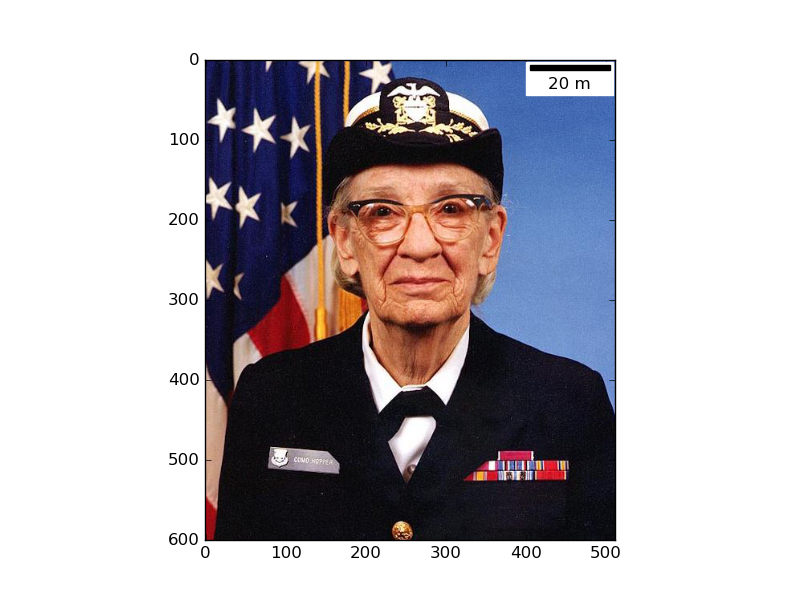
Here is an example how to add a scale bar:
>>> import matplotlib.pyplot as plt
>>> import matplotlib.cbook as cbook
>>> from matplotlib_scalebar.scalebar import ScaleBar
>>> plt.figure()
>>> image = plt.imread(cbook.get_sample_data('grace_hopper.png'))
>>> plt.imshow(image)
>>> scalebar = ScaleBar(0.2) # 1 pixel = 0.2 meter
>>> plt.gca().add_artist(scalebar)
>>> plt.show()
The scale bar also works with reciprocal units,:
>>> from matplotlib_scalebar.scalebar import SI_LENGTH_RECIPROCAL
>>> scalebar = ScaleBar(0.2, '1/cm', SI_LENGTH_RECIPROCAL) # 1 pixel = 0.2 1/cm
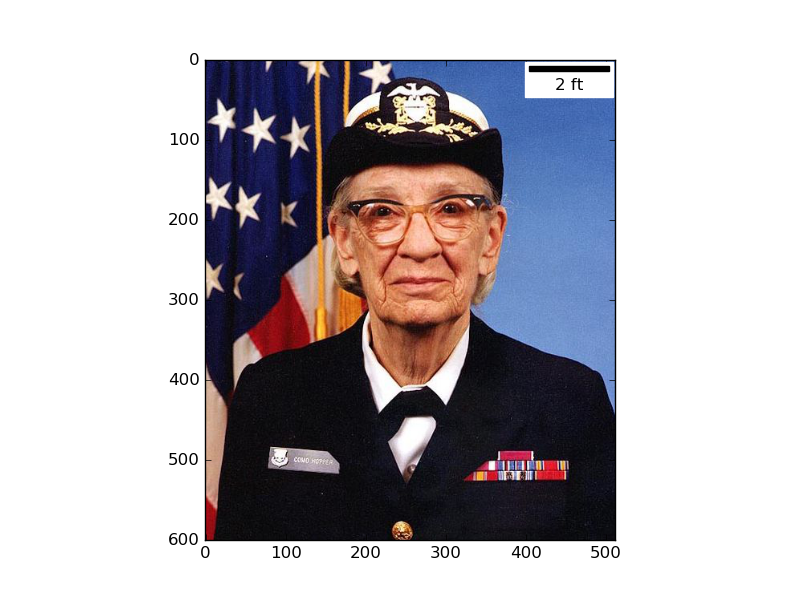
imperial units:
>>> from matplotlib_scalebar.scalebar import IMPERIAL_LENGTH
>>> scalebar = ScaleBar(0.2, 'ft', IMPERIAL_LENGTH) # 1 pixel = 0.2 feet
and system defined by the Dimension class.
ScaleBar arguments
Here are parameters of the ScaleBar class constructor.
dx: Size of one pixel in units specified by the next argument (required). Set dx to 1.0 if the axes image has already been calibrated by setting its extent.
units: units of dx (default: m)
dimension: dimension of dx and units. It can either be equal
SI_LENGTH: scale bar showing km, m, cm, etc.
IMPERIAL_LENGTH: scale bar showing in, ft, yd, mi, etc.
SI_LENGTH_RECIPROCAL: scale bar showing 1/m, 1/cm, etc.
a matplotlib_scalebar.dimension._Dimension object
label: optional label associated with the scale bar (default: None, no label is shown)
length_fraction: length of the scale bar as a fraction of the axes’s width (default: rcParams['scalebar.lenght_fraction'] or 0.2)
height_fraction: height of the scale bar as a fraction of the axes’s height (default: rcParams['scalebar.height_fraction'] or 0.01)
location: a location code (same as legend) (default: rcParams['scalebar.location'] or upper right)
pad: fraction of the font size (default: rcParams['scalebar.pad'] or 0.2)
border_pad: fraction of the font size (default: rcParams['scalebar.border_pad'] or 0.1)
sep: separation between scale bar and label in points (default: rcParams['scalebar.sep'] or 5)
frameon: if True, will draw a box around the scale bar and label (default: rcParams['scalebar.frameon'] or True)
color: color for the scale bar and label (default: rcParams['scalebar.color'] or k)
box_color: color of the box (if frameon) (default: rcParams['scalebar.box_color'] or w)
box_alpha: transparency of box (default: rcParams['scalebar.box_alpha'] or 1.0)
scale_loc: either bottom, top, left, right (default: rcParams['scalebar.scale_loc'] or bottom)
label_loc: either bottom, top, left, right (default: rcParams['scalebar.label_loc'] or top)
font_properties: font properties of the label text, specified either as dict or fontconfig pattern (XML).
label_formatter: custom function called to format the scalebar text. Needs to take 2 arguments - the scale value and the unit. (default: None which results in <value> <unit>)
fixed_value: value for the scale bar. If None, the value is automatically determined based on length_fraction.
fixed_units: units of the fixed_value. If None and fixed_value is not None, the units of dx are used.
matplotlibrc parameters
Here are parameters that can be customized in the matplotlibrc file.
scalebar.length_fraction: length of the scale bar as a fraction of the axes’s width (default: 0.2)
scalebar.height_fraction: height of the scale bar as a fraction of the axes’s height (default: 0.01)
scalebar.location: a location code (same as legend) (default: upper right)
scalebar.pad: fraction of the font size (default: 0.2)
scalebar.border_pad: fraction of the font size (default: 0.1)
scalebar.sep: separation between scale bar and label in points (default: 5)
scalebar.frameon: if True, will draw a box around the scale bar and label (default: True)
scalebar.color: color for the scale bar and label (default: k)
scalebar.box_color: color of the box (if frameon) (default: w)
scalebar.box_alpha: transparency of box (default: 1.0)
scalebar.label_top: if True, the label will be over the scale bar (default: False)
scalebar.font_properties: font properties of the label text, specified either as dict or fontconfig pattern (XML).
Release notes
0.4.1
Fix deprecated usage of is_string_like (#11)
0.4.0
Add possibility to specified a fixed value for the scale bar (#9)
Contributors
@maweigert, @crosbyla, @joschkazj, @AKuederle and @habi
License
License under the BSD License, compatible with matplotlib.
Copyright (c) 2015-2017 Philippe Pinard
Release history Release notifications | RSS feed


Download files
Download the file for your platform. If you're not sure which to choose, learn more about installing packages.
Source Distribution
Built Distribution
Hashes for matplotlib-scalebar-0.4.1.tar.gz
| Algorithm | Hash digest | |
|---|---|---|
| SHA256 | 6a39b1d3ee0e79b6053b6de596d3b974bc6b258c39d27182725cfdbafdbd4d2a |
|
| MD5 | 6f961a4b32199b67256beabfeeed01e7 |
|
| BLAKE2b-256 | 3675047187694e7e1f7d4fa992281fd333c97f05e409545210f655ac0cb0cb99 |
Hashes for matplotlib_scalebar-0.4.1-py2.py3-none-any.whl
| Algorithm | Hash digest | |
|---|---|---|
| SHA256 | c505441356e6e01938e6a8d1dfbb137e0b012bb890563aa26e87791d9803a1fd |
|
| MD5 | f8d52e46125bd97b82a992aeb5671585 |
|
| BLAKE2b-256 | a77f1f8b86e05e6fd2a84925a6cdb3215041ec962505daf039cf1f9c8a144b36 |


