Plot in the terminal using braille dots.

Project description


Plot, scatter plots and histograms in the terminal using braille dots, with no external dependancies. For good visualization, use a font / terminal with monospaced braille characters.
Install:
pipenv install plotilleSimilar to other libraries:
like drawille, but focused on graphing – plus X/Y-axis.
like termplot, but with braille (finer dots), left to right histogram and linear interpolation for plotting function.
like termgraph (not on pypi), but very different style.
like terminalplot, but with braille, X/Y-axis, histogram, linear interpolation.
Documentation
In [1]: import plotille
In [2]: import numpy as np
In [3]: X = sorted(np.random.normal(size=1000))
Plot:
In [4]: plotille.plot?
Signature: plot(X, Y, width=80, height=40, X_label='X', Y_label='Y', linesep='\n', interp='linear', x_min=None, x_max=None, y_min=None, y_max=None)
Docstring:
Create plot with X , Y values and linear interpolation between points

Parameters:
    X: List[float]         X values.
    Y: List[float]         Y values. X and Y must have the same number of entries.
    width: int             The number of characters for the width (columns) of the canvas.
    hight: int             The number of characters for the hight (rows) of the canvas.
    X_label: str           Label for X-axis.
    Y_label: str           Label for Y-axis. max 8 characters.
    linesep: str           The requested line seperator. default: os.linesep
    interp: Optional[str]  Specify interpolation; values None, 'linear'
    x_min, x_max: float    Limits for the displayed X values.
    y_min, y_max: float    Limits for the displayed Y values.

Returns:
    str: plot over `X`, `Y`.

In [5]: print(plotille.plot(X, np.sin(X), height=50))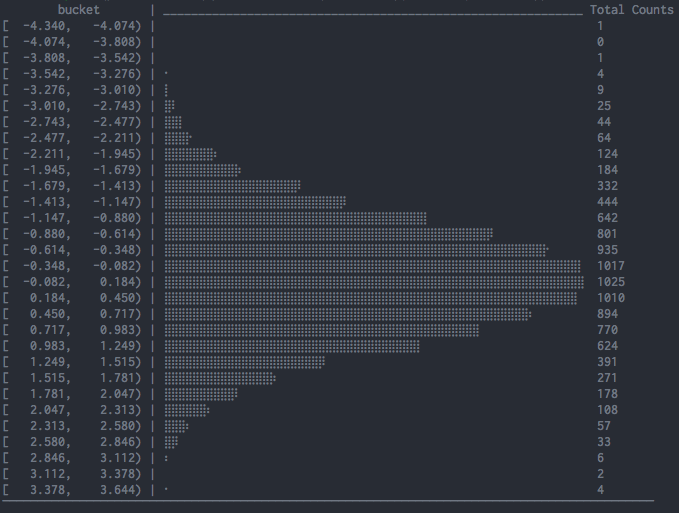
Scatter:
In [6]: plotille.scatter?
Signature: scatter(X, Y, width=80, height=40, X_label='X', Y_label='Y', linesep='\n', x_min=None, x_max=None, y_min=None, y_max=None)
Docstring:
Create scatter plot with X , Y values

Basically plotting without interpolation:
    `plot(X, Y, ... , interp=None)`

Parameters:
    X: List[float]       X values.
    Y: List[float]       Y values. X and Y must have the same number of entries.
    width: int           The number of characters for the width (columns) of the canvas.
    hight: int           The number of characters for the hight (rows) of the canvas.
    X_label: str         Label for X-axis.
    Y_label: str         Label for Y-axis. max 8 characters.
    linesep: str         The requested line seperator. default: os.linesep
    x_min, x_max: float  Limits for the displayed X values.
    y_min, y_max: float  Limits for the displayed Y values.

Returns:
    str: scatter plot over `X`, `Y`.

In [7]: print(plotille.scatter(X, np.sin(X), height=50))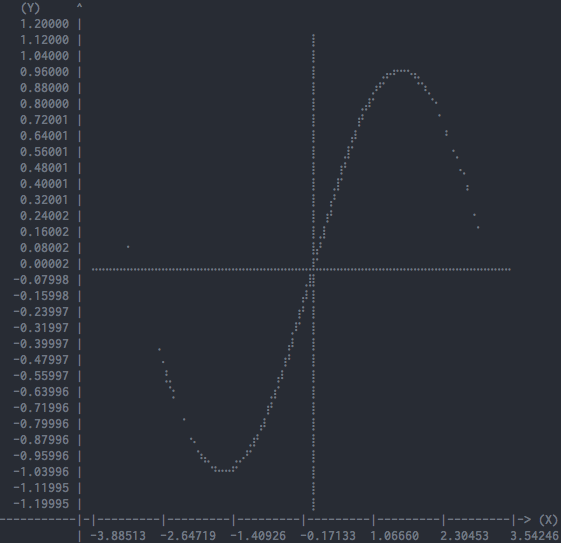
Hist:
Inspired by crappyhist.
In [8]: plotille.hist?
Signature: hist(X, bins=40, width=80, log_scale=False, linesep='\n')
Docstring:
Create histogram over `X` from left to right

The values on the left are the center of the bucket, i.e. `(bin[i] + bin[i+1]) / 2`.
The values on the right are the total counts of this bucket.

Parameters:
    X: List[float]  The items to count over.
    bins: int       The number of bins to put X entries in (rows).
    width: int      The number of characters for the width (columns).
    log_scale: bool Scale the histogram with `log` function.
    linesep: str    The requested line seperator. default: os.linesep

Returns:
    str: histogram over `X` from left to right.

In [9]: print(plotille.hist(np.random.normal(size=10000)))
Histogram:
There is also another more ‘usual’ histogram function available:
In [10]: plotille.hist?
Signature: histogram(X, bins=160, width=80, height=40, X_label='X', Y_label='Counts', linesep='\n', x_min=None, x_max=None, y_min=None, y_max=None)
Docstring:
Create histogram over `X`

In contrast to `hist`, this is the more `usual` histogram from bottom
to up. The X-axis represents the values in `X` and the Y-axis is the
corresponding frequency.

Parameters:
    X: List[float]  The items to count over.
    bins: int       The number of bins to put X entries in (columns).
    height: int     The number of characters for the height (rows).
    X_label: str    Label for X-axis.
    Y_label: str    Label for Y-axis. max 8 characters.
    linesep: str    The requested line seperator. default: os.linesep
    x_min, x_max: float  Limits for the displayed X values.
    y_min, y_max: float  Limits for the displayed Y values.

Returns:
    str: histogram over `X`.

In [11]: print(plotille.histogram(np.random.normal(size=10000)))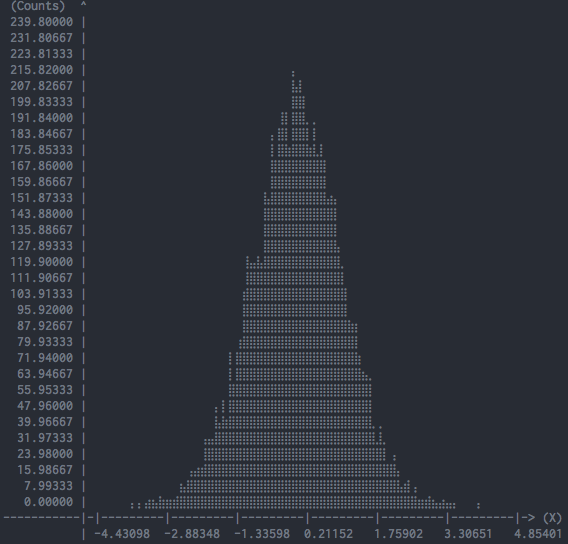
Canvas:
The underlying plotting area is modeled as the Canvas class:
In [12]: plotille.Canvas?
Init signature: Canvas(width, height, xmin=0, ymin=0, xmax=1, ymax=1)
Docstring:
A canvas object for plotting braille dots

A Canvas object has a `width` x `height` characters large canvas, in which it
can plot indivitual braille point, lines out of braille points, rectangles,...
Since a full braille character has 2 x 4 dots (⣿), the canvas has `width` * 2, `height` * 4
dots to plot into in total.

It maintains two coordinate systems: a reference system with the limits (xmin, ymin)
in the lower left corner to (xmax, ymax) in the upper right corner is transformed
into the canvas discrete, i.e. dots, coordinate system (0, 0) to (`width` * 2, `height` * 4).
It does so transparently to clients of the Canvas, i.e. all plotting functions
only accept coordinates in the reference system. If the coordinates are outside
the reference system, they are not plotted.
Init docstring:
Initiate a Canvas object

Parameters:
    width: int         The number of characters for the width (columns) of the canvas.
    hight: int         The number of characters for the hight (rows) of the canvas.
    xmin, ymin: float  Lower left corner of reference system.
    xmax, ymax: float  Upper right corner of reference system.

Reurns:
    Canvas object
The most interesting functions are:
point:
In [13]: plotille.Canvas.point?
Signature: Canvas.point(self, x, y, set_=True)
Docstring:
Put a point into the canvas at (x, y) [reference coordinate system]

Parameters:
    x: float    x-coordinate on reference system.
    y: float    y-coordinate on reference system.
    set_: bool  Whether to plot or remove the point.
line:
In [14]: Canvas.line?
Signature: Canvas.line(self, x0, y0, x1, y1, set_=True)
Docstring:
Plot line between point (x0, y0) and (x1, y1) [reference coordinate system].

Parameters:
    x0, y0: float  Point 0
    x1, y1: float  Point 1
    set_: bool     Whether to plot or remove the line.
rect:
In [15]: Canvas.rect?
Signature: Canvas.rect(self, xmin, ymin, xmax, ymax, set_=True)
Docstring:
Plot rectangle with bbox (xmin, ymin) and (xmax, ymax) [reference coordinate system].

Parameters:
    xmin, ymin: float  Lower left corner of rectangle.
    xmax, ymax: float  Upper right corner of rectangle.
    set_: bool         Whether to plot or remove the rect.
plot:
In [16]: Canvas.plot?
Signature: Canvas.plot(self, x_axis=False, y_axis=False, y_label='Y', x_label='X', linesep='\n')
Docstring:
Transform canvas into `print`-able string

Parameters:
    x_axis: bool  Add a X-axis at the bottom.
    y_axis: bool  Add a Y-axis to the left.
    y_label: str  Label for Y-axis. max 8 characters.
    x_label: str  Label for X-axis.
    linesep: str  The requested line seperator. default: os.linesep

Returns:
    unicode: The cancas as a string.
You can use it for example to plot a house in the terminal:
In [17]: c = Canvas(width=40, height=20)
In [18]: c.rect(0.1, 0.1, 0.6, 0.6)
In [19]: c.line(0.1, 0.1, 0.6, 0.6)
In [20]: c.line(0.1, 0.6, 0.6, 0.1)
In [21]: c.line(0.1, 0.6, 0.35, 0.8)
In [22]: c.line(0.35, 0.8, 0.6, 0.6)
In [23]: print(c.plot())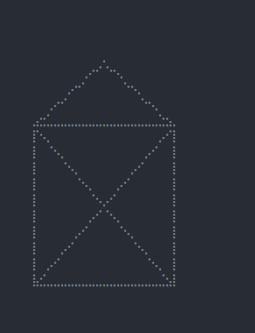
Release history Release notifications | RSS feed


Download files
Download the file for your platform. If you're not sure which to choose, learn more about installing packages.


