A set of tools for analyzing 3D images of porous materials


Project description


What is PoreSpy?
PoreSpy is a collection of image analysis tools used to extract
information from 3D images of porous materials (typically obtained from
X-ray tomography). There are many packages that offer generalized image
analysis tools (i.e Skimage and Scipy.NDimage in the Python environment,
ImageJ, MatLab's Image Processing Toolbox), but they all require building
up complex scripts or macros to accomplish tasks of specific use to
porous media. The aim of PoreSpy is to provide a set of pre-written
tools for all the common porous media measurements. For instance, it's possible to perform a mercury intrusion simulation with a single function call (e.g. porespy.filters.porosimetry).
PoreSpy relies heavily on scipy.ndimage and scikit-image also known as skimage. The former contains an assortment of general image analysis tools such as image morphology filters, while the latter offers more complex but still general functions such as watershed segmentation. PoreSpy does not duplicate any of these general functions so you will also have to install and learn how to use them to get the most from PoreSpy. The functions in PoreSpy are generally built up using several of the general functions offered by skimage and scipy. There are a few functions in PoreSpy that are implemented natively, but only when necessary.
Capabilities
PoreSpy consists of the following modules:
generators: Routines for generating artificial images of porous materials useful for testing and illustrationfilters: Functions that accept an image and return an altered imagemetrics: Tools for quantifying properties of imagesnetworks: Algorithms and tools for analyzing images as pore networkssimulations: Physical simulations on images including drainagevisualization: Helper functions for creating useful views of the imageio: Functions for outputting image data in various formats for use in common softwaretools: Various useful tools for working with images
Gallery

Cite as
Gostick J, Khan ZA, Tranter TG, Kok MDR, Agnaou M, Sadeghi MA, Jervis R. PoreSpy: A Python Toolkit for Quantitative Analysis of Porous Media Images. Journal of Open Source Software, 2019. doi:10.21105/joss.01296
Installation
For detailed and up to date installation instructions, see here
Contributing
If you think you may be interested in contributing to PoreSpy and wish to both use and edit the source code, then you should clone the repository to your local machine, and install it using the following PIP command:
pip install -e "C:\path\to\the\local\files\"
For information about contributing, refer to the contributors guide
Acknowledgements
PoreSpy is grateful to CANARIE for their generous funding over the past few years. We would also like to acknowledge the support of NSERC of Canada for funding many of the student that have contributed to PoreSpy since it's inception in 2014.
Examples
The following code snippets illustrate generating a 2D image, applying several filters, and calculating some common metrics. A set of examples is included in this repo, and can be browsed here.
Generating an image
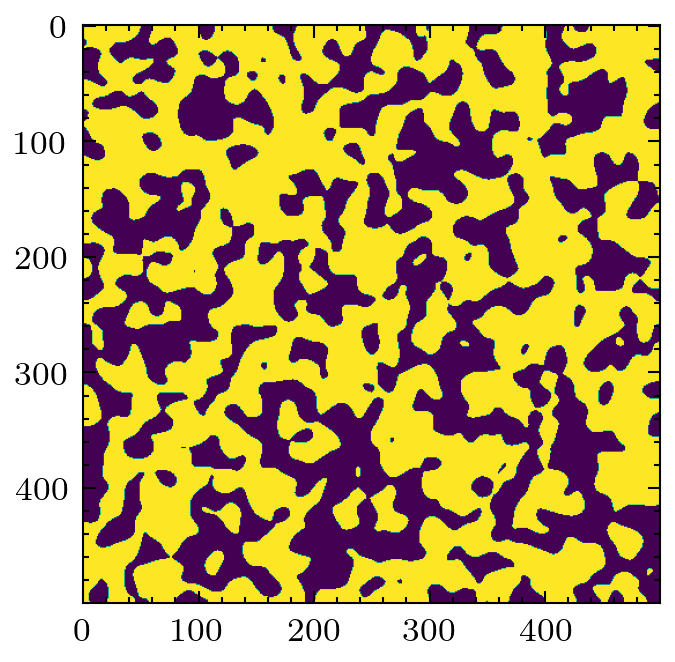
PoreSpy offers several ways to generate artificial images, for quick testing and developmnet of work flows, instead of dealing with reading/writing/storing of large tomograms.
import porespy as ps
import matplotlib.pyplot as plt
im = ps.generators.blobs(shape=[500, 500], porosity=0.6, blobiness=2)
plt.imshow(im)
Applying filters
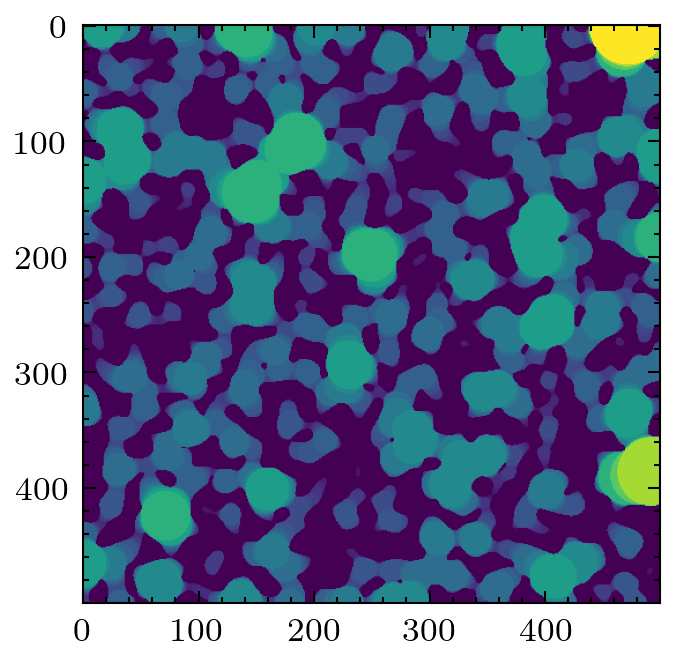
A common filter to apply is the local thickness, which replaces every voxel with the radius of a sphere that overlaps it. Analysis of the histogram of the voxel values provides information about the pore size distribution.
lt = ps.filters.local_thickness(im)
plt.imshow(lt)
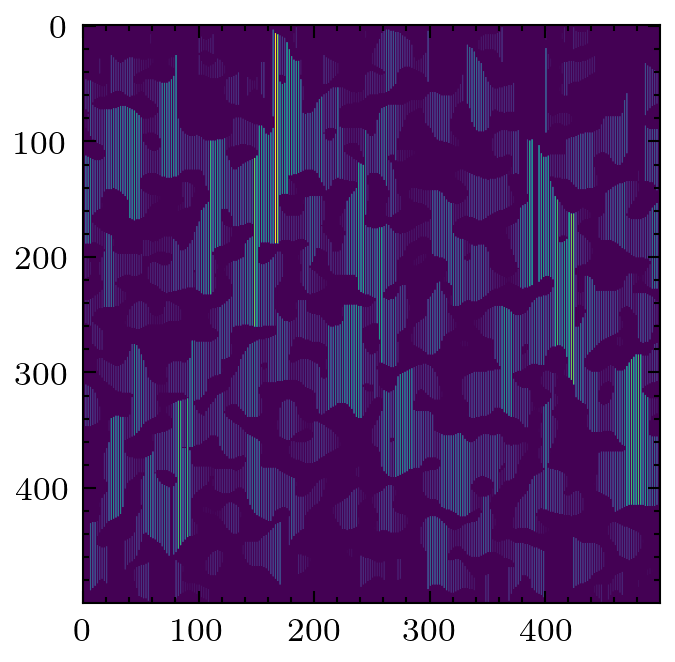
A less common filter is the application of chords that span the pore space in a given direction. It is possible to gain information about anisotropy of the material by looking at the distributions of chords lengths in each principle direction.
cr = ps.filters.apply_chords(im)
cr = ps.filters.flood(cr, mode='size')
plt.imshow(cr)
Calculating metrics
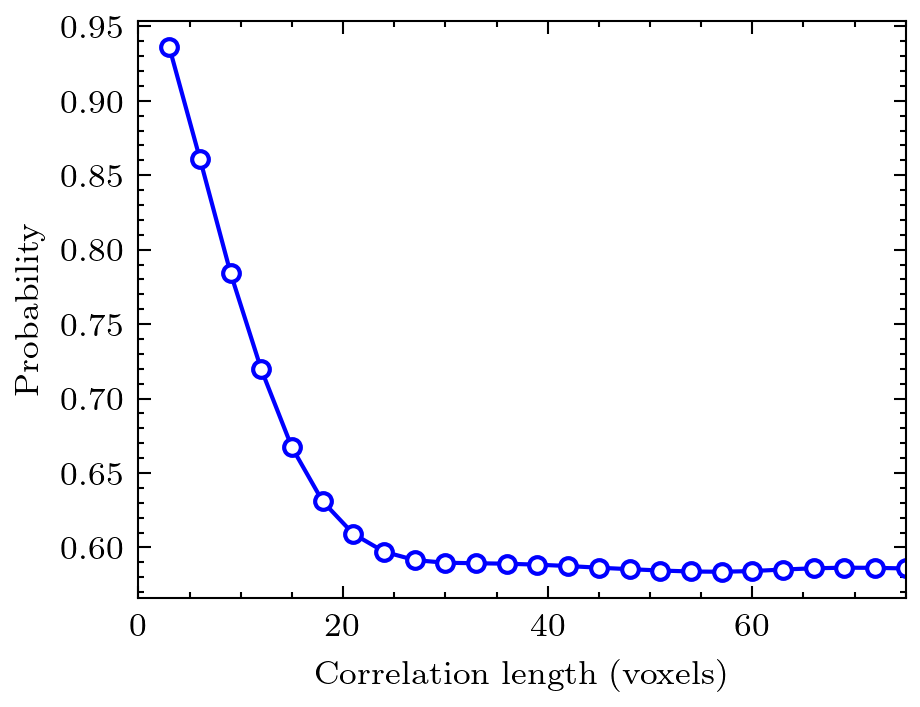
The metrics sub-module contains several common functions that analyze binary tomogram directly. Examples are simple porosity, as well as two-point correlation function.
data = ps.metrics.two_point_correlation_fft(im)
fig = plt.plot(*data, 'bo-')
plt.ylabel('probability')
plt.xlabel('correlation length [voxels]')
The metrics sub-module also contains a suite of functions that produce plots based on values in images that have passed through a filter, such as local thickness.
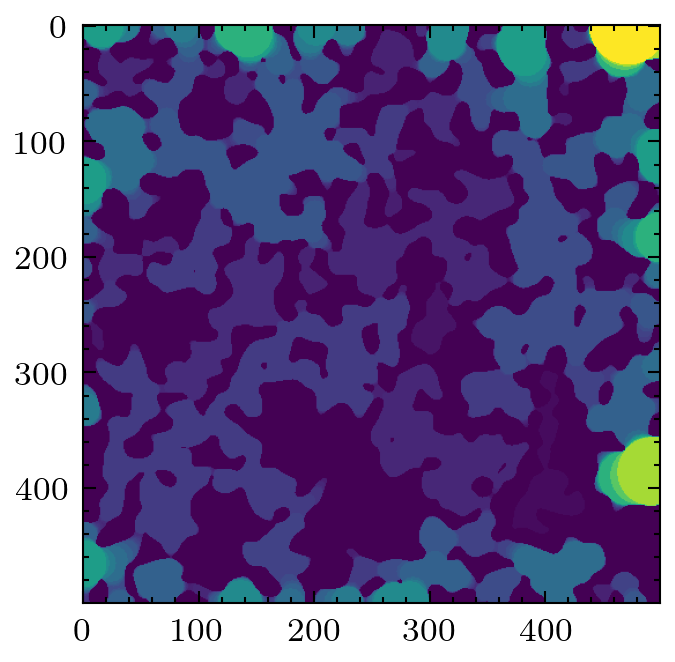
mip = ps.filters.porosimetry(im)
data = ps.metrics.pore_size_distribution(mip, log=False)
plt.imshow(mip)
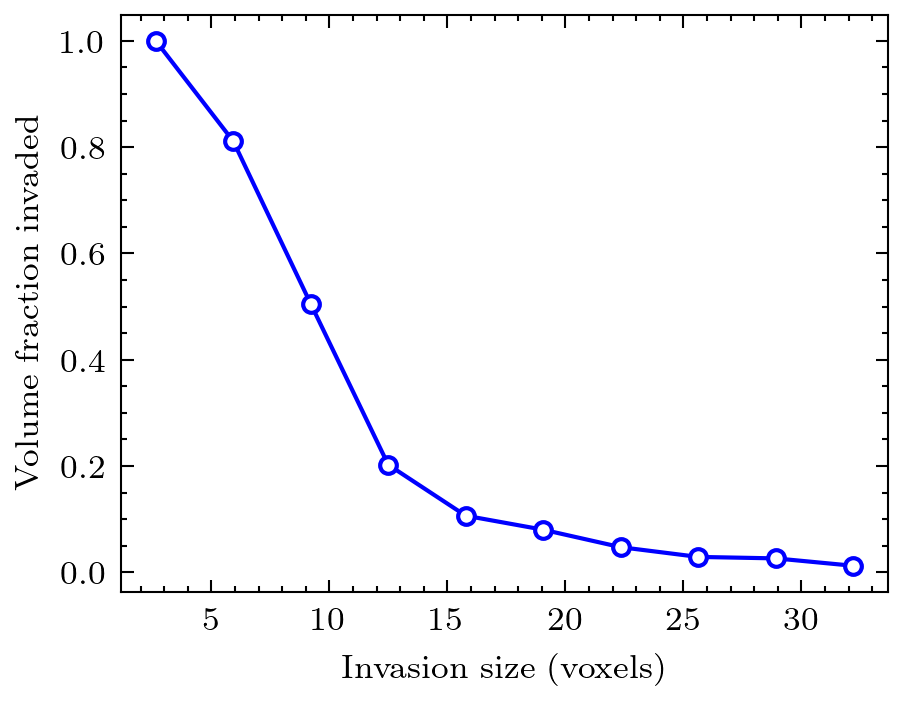
# Now show intrusion curve
plt.plot(data.R, data.cdf, 'bo-')
plt.xlabel('invasion size [voxels]')
plt.ylabel('volume fraction invaded [voxels]')