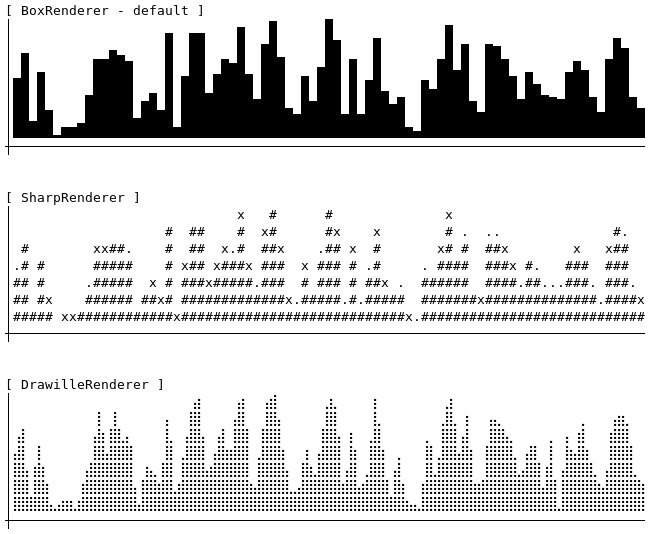
Minimal graph renderer for fixed size canvas

Project description


Minimal chart renderer for fixed size canvas for Python.
Installation
pip install tchart
Usage
simple way:
from tchart import Tchart

t = Tchart(height=10, width=80)

data = [12.1, -2, 100]
chart = t.render(data)

print('\n'.join(chart))
extended way:
from tchart import Tchart
from tchart.renderers import BoxRenderer
from tchart.decorators import AxisDecorator

t = Tchart(height=10, width=80, renderer=BoxRenderer(), decorators=[AxisDecorator(), ])

data = [12.1, -2, 100]
chart = t.render(data)

print('\n'.join(chart))
Examples
Please check the examples directory.
- examples/show_all_renderers.py
- examples/show_all_decorators.py
- examples/show_stacked_decorators.py


Bugs
Bugs or suggestions? Visit the issue tracker.


Download files
Download the file for your platform. If you're not sure which to choose, learn more about installing packages.
Source Distribution
tchart-2.0.0.tar.gz
(18.3 kB
view hashes)
Built Distribution
Close
Hashes for tchart-2.0.0-py2.py3-none-any.whl
| Algorithm | Hash digest | |
|---|---|---|
| SHA256 | 57a3c304eeb7fc3b6bff1994a68df40cac0fb75c89929798736d5cba19500c5a |
|
| MD5 | a81b4e6aa3d0c49c7d3bcafb6aa39036 |
|
| BLAKE2b-256 | 5078642d89c1a65b8b02f4ea42fbef96d903112277eb9e2888125e728420b002 |


