Plot points in terminal

Project description


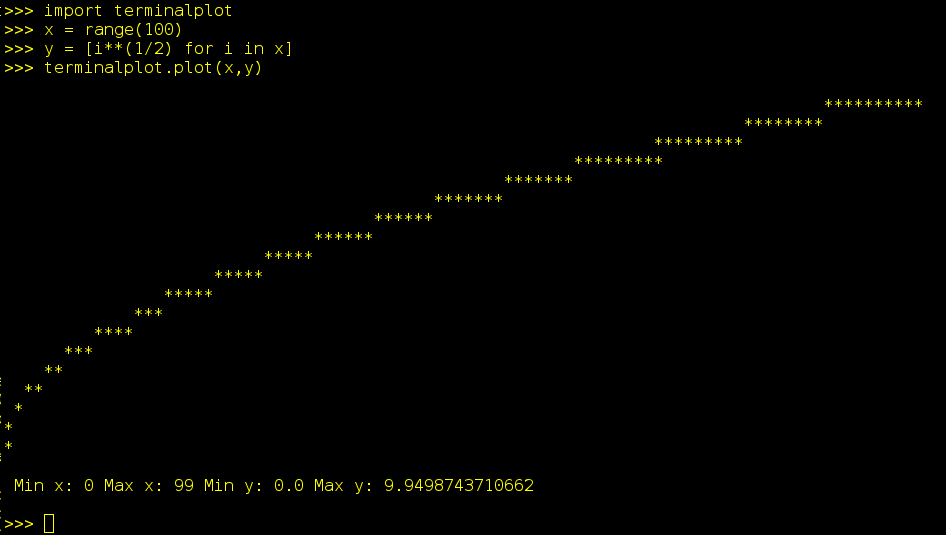
Terminalplot is a minimalistic packgage, that only prints points to the terminal. It does not have any dependencies.
Installation
pip install terminalplotUsage
Command Line
Get size of terminal emulator (tty):
$ plot -s
Rows: 25, Columns: 80
Plot some points:
$ plot -x '-1 0 1 2 3 4' -y '0.1 0.2 0.23 0.234 0.24'
API
Plotting a graph
from terminalplot import plot
x = range(100)
y = [i**2 for i in x]
plot(x, y)
Get size of current terminal window
from terminalplot import get_terminal_size
get_terminal_size()Release history Release notifications | RSS feed


Download files
Download the file for your platform. If you're not sure which to choose, learn more about installing packages.
Source Distribution
terminalplot-0.2.6.tar.gz
(3.5 kB
view hashes)
Built Distribution
Close
Hashes for terminalplot-0.2.6-py2.py3-none-any.whl
| Algorithm | Hash digest | |
|---|---|---|
| SHA256 | ac1c9b45c87dda2ef890a6bc2650838ef85dbe4e0bfd630679ba5cca2f323791 |
|
| MD5 | f1fd0dc56be6dcc0761c1ac16c2b53e0 |
|
| BLAKE2b-256 | 0dd824d7785a14a8f15b9ecde49af899e7c16f402f68b31d4776155b1a28df57 |


