A database access profiler for Django-based applications that can be ran in production with minimal performace overhead.

Project description
Profile Django-based applications running in production with minimal performance overhead.
Rationale
Profiling web applications on a development environment often produces misleading results due to different patterns in the data, different patterns in user behavior and differences in infrastructure.
All existing DB access profiling solutions for Django seem to be focusing on a single request. However, in the real world certain queries might be negligible in a single request while still putting a considerable strain the database across all requests.
django-live-profiler aims to solve these issues by collecting database usage data from a live application.
Installation
Run pip install django-live-profiler
Add ‘profiler’ app to INSTALLED_APPS
Add ‘profiler.middleware.ProfilerMiddleware’ to MIDDLEWARE_CLASSES
Optionally add ‘profiler.middleware.StatProfMiddleware’ to MIDDLEWARE_CLASSES to enable Python code statistical profiling (using statprof). WARNING: this currently incurs a significant performance penalty.
Add url(r’^profiler/’, include(‘profiler.urls’)) to your urlconf
In order to start gathering data you need to start the aggregation server:
$ aggregated --host 127.0.0.1 --port 5557
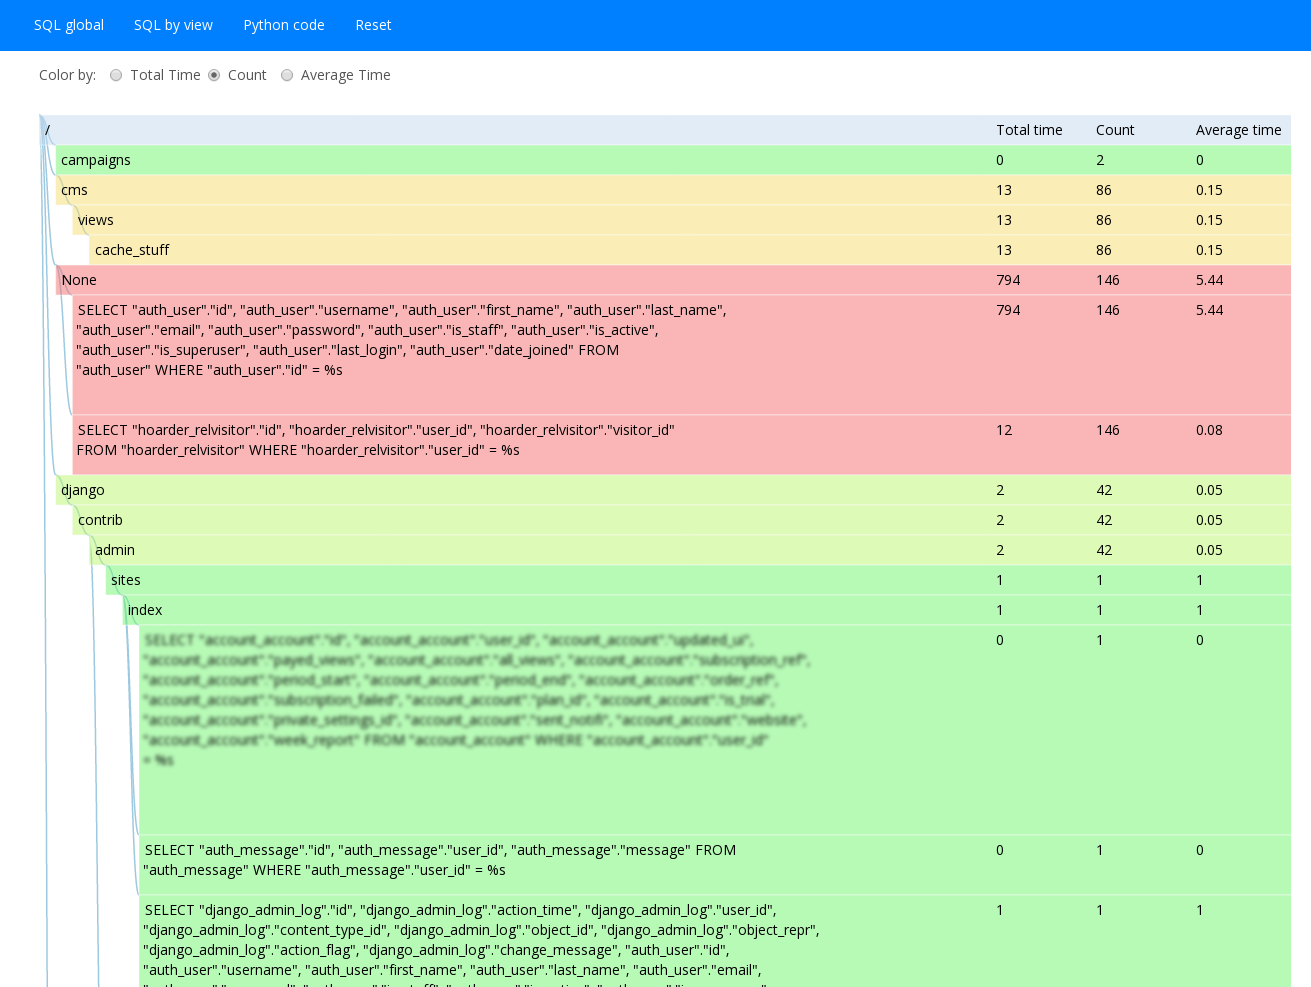
Visit http://yoursite.com/profiler/ for results.


Download files
Download the file for your platform. If you're not sure which to choose, learn more about installing packages.
Source Distribution
Hashes for django-live-profiler-0.0.8.tar.gz
| Algorithm | Hash digest | |
|---|---|---|
| SHA256 | 21538f55230ebdb2a8610305ca40e3c8b0373e5cccf4806d5f169595103168be |
|
| MD5 | 391bb62aaa178bd13875b084d10a69c9 |
|
| BLAKE2b-256 | b70c88647fdfe78c4b0f8bb8450848651967c17520b0a7d1cdf48c3fb32af829 |


