parse and visualize iosnoop output

Project description
iosnoop-tool
parse and visualize iosnoop output
What is iosnoop?
iosnoop is a tracing tool for disk I/O events and created by Brendan D. Gregg. Originally, it is for Solaris/MacOS X using DTrace.
iosnoop - A program to print disk I/O events as they happen, with useful details such as UID, PID, filename (if available), command, etc. Written using DTrace (Solaris 10 3/05, MacOS X 10.5).
And then, iosnoop was ported for Linux using ftrace. Refer to his blog for iosnoop detail.
I'm probably dreaming. I just ported my popular iosnoop tool to Linux:
http://www.brendangregg.com/blog/2014-07-16/iosnoop-for-linux.html
Linux ported iosnoop is a simple bash script and can be downloaded from here.
The output is like this. iosnoop requires root permission to run. iosnoop summarizes block device I/O (disk I/O) latency (LATms) with 1 line.
$ sudo path/to/iosnoop -ts
Tracing block I/O. Ctrl-C to end.
STARTs          ENDs            COMM         PID    TYPE DEV      BLOCK        BYTES     LATms
14545946.332115 14545946.344366 <...>        17185  WS   8,160    4840587442   4096      12.25
14545946.331036 14545946.347082 main         17197  WS   8,160    4840666914   4096      16.05
14545946.332136 14545946.348852 <...>        17185  WS   8,160    4840643666   4096      16.72
14545946.331067 14545946.352752 main         17197  WS   8,160    4844855458   4096      21.69
14545946.332146 14545946.355893 <...>        17185  WS   8,160    4844863762   4096      23.75
14545946.356584 14545946.358920 <idle>       0      WS   8,160    4844859722   4096       2.34
14545946.356238 14545946.361128 <idle>       0      WS   8,160    4844855466   4096       4.89
14545946.356943 14545946.364070 <idle>       0      WS   8,160    4844863770   4096       7.13
Why iosnoop-tool?
iosnoop-tool is a visualizing tool for iosnoop output.
Brendan also has provided a visualization tool named trace2heatmap.pl, and introduced how to make Heatmap from iosnoop output.
I confirmed this tool works and know heatmap seems good enough. However, I am not good at reading/writing perl script, so I created my visualization tool in order to customize for my purpose.
Requirements
- Python >= 3.4
- Seaborn
- Support output of iosnoop for Linux only
- need
-tsarguments
- need
$ sudo iosnoop -ts
How to install
for developer
Create virtualenv to install iosnoop-tool.
$ mkdir virtualenvs
$ virtualenv -p python3 virtualenvs/venv
$ source virtualenvs/venv/bin/activate
(venv) $
Install iosnoop-tool package from the repository.
(venv) $ git clone https://github.com/t2y/iosnoop-tool.git
(venv) $ cd iosnoop-tool
(venv) $ python setup.py develop
Base CLI options
Confirm iosnoop-cli works as below.
(venv) $ iosnoop-cli --help
usage: iosnoop-cli [-h] [--basedate BASEDATE] --data DATA
                   [--columns COLUMNS [COLUMNS ...]]
                   [--io-commands IO_COMMANDS [IO_COMMANDS ...]]
                   [--io-device IO_DEVICE] [--io-pids IO_PIDS [IO_PIDS ...]]
                   [--io-types IO_TYPES [IO_TYPES ...]] [--since SINCE]
                   [--until UNTIL] [-v] [--version]
                   {csv,plot} ...

positional arguments:
  {csv,plot}

optional arguments:
  -h, --help            show this help message and exit
  --basedate BASEDATE   set base datetime to convert kernel timestamp to
                        localtime, format: yyyymmddHHMISS
  --data DATA           set path to iosnoop output file
  --columns COLUMNS [COLUMNS ...]
                        set columns name in iosnoop output
  --io-commands IO_COMMANDS [IO_COMMANDS ...]
                        set commands in iosnoop output
  --io-device IO_DEVICE
                        set device in iosnoop output
  --io-pids IO_PIDS [IO_PIDS ...]
                        set process ids in iosnoop output
  --io-types IO_TYPES [IO_TYPES ...]
                        set types in iosnoop output
  --since SINCE         set seconds since relative difference from start
  --until UNTIL         set seconds until relative difference from start
  -v, --verbose         set verbose mode
  --version             show program version
Sub Commands
csv
Create csv/tsv file from output of iosnoop.
(venv) $ iosnoop-cli csv --help
usage: iosnoop-cli csv [-h] [--dialect {excel,excel-tab,unix}]
                       [--output OUTPUT] [--separator SEPARATOR]

optional arguments:
  -h, --help            show this help message and exit
  --dialect {excel,excel-tab,unix}
                        set dialect for csv writer, default is excel
  --output OUTPUT       set path to save csv file of iosnoop
  --separator SEPARATOR
                        set separator (choose from comma, tab), default is comma
plot
Create image file rendered by seaborn from output of iosnoop.
(venv) $ iosnoop-cli plot --help
usage: iosnoop-cli plot [-h] [--backend BACKEND] [--colormap COLORMAP]
                        [--fig-output FIGOUTPUT] [--fig-size FIGSIZE]
                        [--hspace HSPACE] [--plot-type {heatmap}] [--square]
                        [--subplot-conditions SUBPLOT_CONDITIONS [SUBPLOT_CONDITIONS ...]]
                        [--x-interval X_INTERVAL] [--x-max X_MAX]
                        [--y-interval Y_INTERVAL] [--y-max Y_MAX]

optional arguments:
  -h, --help            show this help message and exit
  --backend BACKEND     set backend for matplotlib, use TkAgg to monitor in
                        the foreground
  --colormap COLORMAP   set color map for seaborn heatmap
  --fig-output FIGOUTPUT
                        set path to save graph
  --fig-size FIGSIZE    set figure size
  --hspace HSPACE       set hspace for subplot
  --plot-type {heatmap}
                        set plot type ("heatmap" by default)
  --square              set square mode for heatmap
  --subplot-conditions SUBPLOT_CONDITIONS [SUBPLOT_CONDITIONS ...]
                        set DataFrame conditions to filter
  --x-interval X_INTERVAL
                        set value of interval for x bins
  --x-max X_MAX         set maximum value for x-axis
  --y-interval Y_INTERVAL
                        set value of interval for y bins
  --y-max Y_MAX         set maximum value for y-axis
How to use
This is sample heatmap rendered by seaborn.
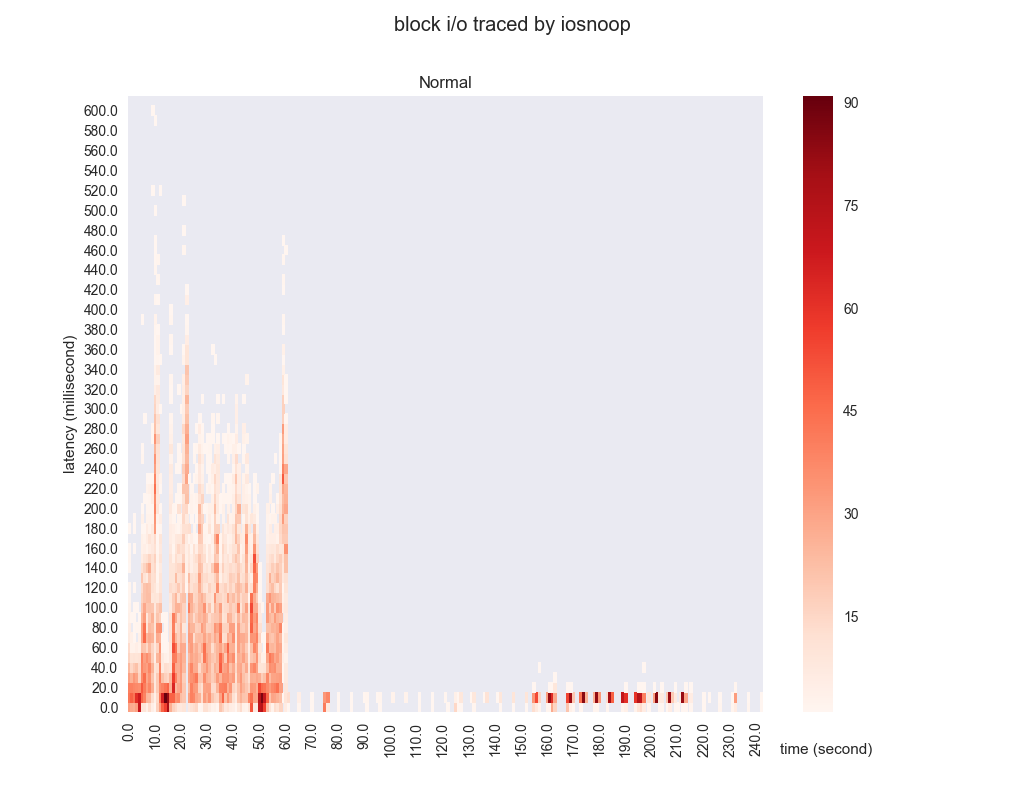
(venv) $ iosnoop-cli --data tests/fixtures/iosnoop-sample.log plot --y-max 600 --y-interval 10 --fig-output tests/fixtures/iosnoop-sample.png
...
(venv) $ file tests/fixtures/iosnoop-sample.png
tests/fixtures/iosnoop-sample.png: PNG image data, 1024 x 800, 8-bit/color RGBA, non-interlaced
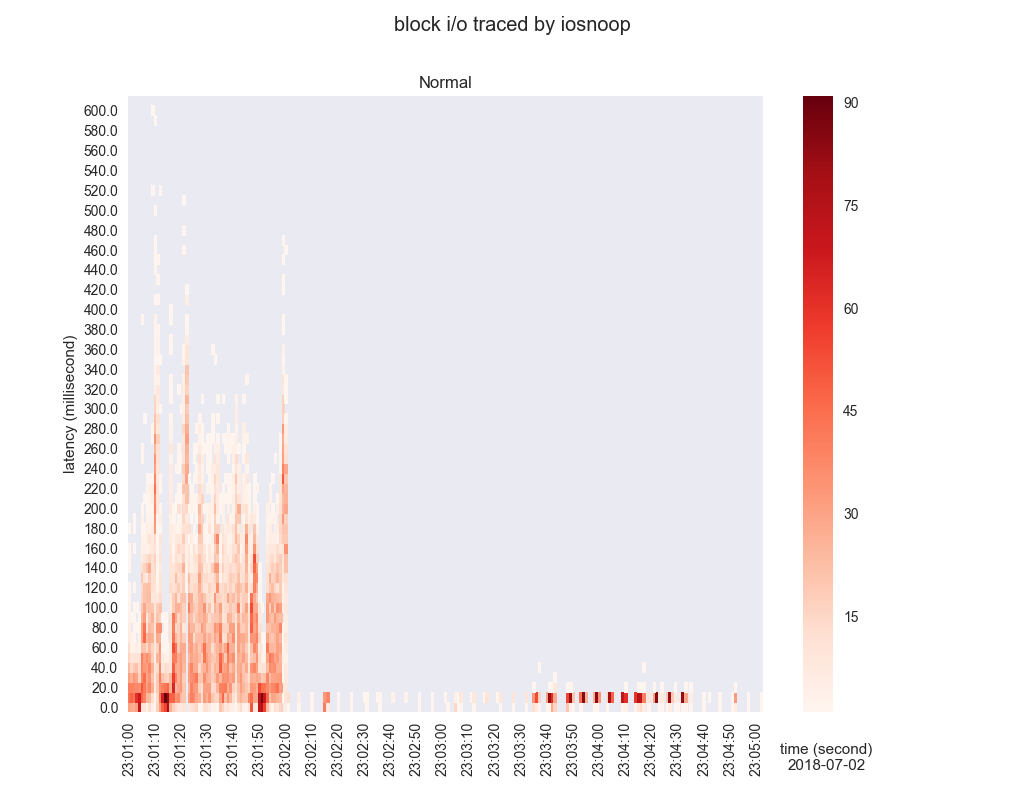
Specifying --basedate options converts kernel timestamp to localtime.
(vent) $ iosnoop-cli --basedate 20180702230100 --data tests/fixtures/iosnoop-sample.log plot --y-max 600 --y-interval 10 --fig-output tests/fixtures/iosnoop-sample-with-basedate.png
Examples
plot
- show graphical window instead of saviing image file
(venv) $ iosnoop-cli --data tests/fixtures/iosnoop-sample.log plot --backend TkAgg
- adjust x-axis and y-axis as needed, default settings might not appropriate depends on output of iosnoop
(venv) $ iosnoop-cli --data tests/fixtures/iosnoop-sample.log plot --x-max 100 --x-interval 2.0 --y-max 300 --y-interval 5
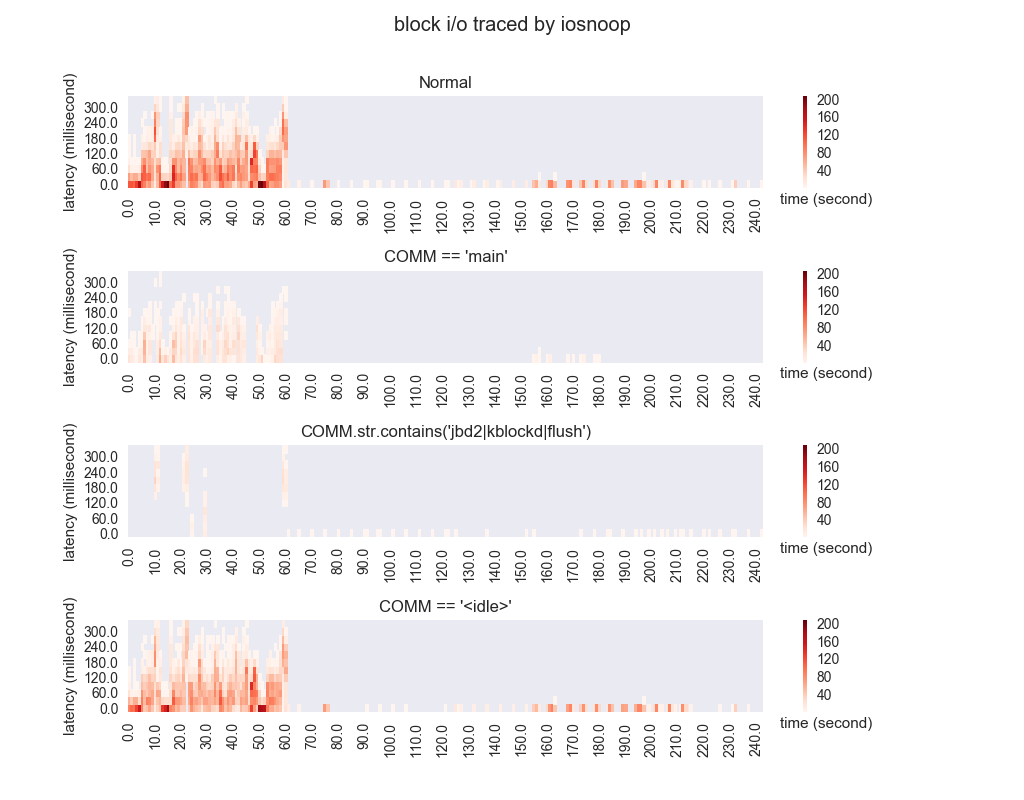
compare multiple subplots
Use header name to retrieve particular data in pandas.DataFrame.
(venv) $ head tests/fixtures/iosnoop-sample.log
STARTs          ENDs            COMM         PID    TYPE DEV      BLOCK        BYTES     LATms
14545946.332115 14545946.344366 <...>        17185  WS   8,160    4840587442   4096      12.25
14545946.331036 14545946.347082 main         17197  WS   8,160    4840666914   4096      16.05
14545946.356943 14545946.364070 <idle>       0      WS   8,160    4844863770   4096       7.13
- retrieved by exact match and contains string, --hspace is used for adjusting height space for each subplots
(venv) $ iosnoop-cli --data tests/fixtures/iosnoop-sample.log plot --y-max 300 --y-interval 30 --subplot-conditions "COMM == 'main'" "COMM.str.contains('jbd2|kblockd|flush')" "COMM == '<idle>'" --hspace 0.9 --fig-output tests/fixtures/iosnoop-sample-comm.png
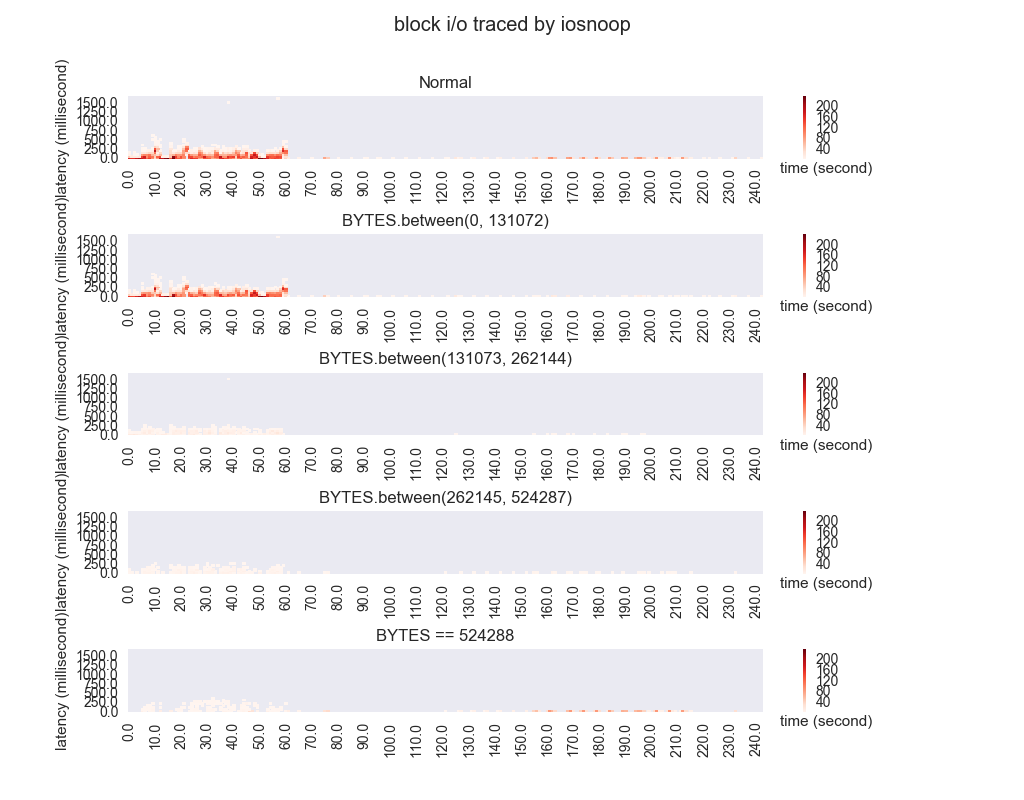
- retrieved by bytes between, --hspace is used for adjusting height space for each subplots
(venv) $ iosnoop-cli --data tests/fixtures/iosnoop-sample.log plot --subplot-conditions "BYTES.between(0, 131072)" "BYTES.between(131073, 262144)" "BYTES.between(262145, 524287)" "BYTES == 524288" --hspace 1.2 --fig-output tests/fixtures/iosnoop-sample-bytes.png
csv
- write contents parsed from iosnoop output as csv file
(venv) $ iosnoop-cli --data tests/fixtures/iosnoop-sample.log csv --output iosnoop.csv
(venv) $ head iosnoop.csv
STARTs,ENDs,COMM,PID,TYPE,DEV,BLOCK,BYTES,LATms,STARTs_DIFF
14545946.332115,14545946.344366,<...>,17185,WS,"8,160",4840587442,4096,12.25,0
14545946.331036,14545946.347082,main,17197,WS,"8,160",4840666914,4096,16.05,-0.0010790005326271057
14545946.332136,14545946.348852,<...>,17185,WS,"8,160",4840643666,4096,16.72,2.099946141242981e-05
Release history Release notifications | RSS feed

Download files
Download the file for your platform. If you're not sure which to choose, learn more about installing packages.


