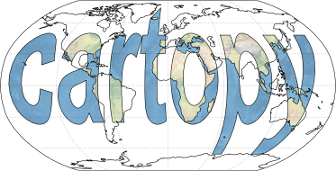
A cartographic python library with Matplotlib support for visualisation
Project description
Cartopy is a Python package designed to make drawing maps for data analysis and visualisation easy.
Table of contents
Overview
Cartopy is a Python package designed to make drawing maps for data analysis and visualisation easy.
It features:
- object oriented projection definitions
- point, line, polygon and image transformations between projections
- integration to expose advanced mapping in Matplotlib with a simple and intuitive interface
- powerful vector data handling by integrating shapefile reading with Shapely capabilities
Documentation can be found at http://scitools.org.uk/cartopy/docs/latest/.
Get in touch
- Ask usage questions on StackOverflow.
- For less well defined questions, ideas, general discussion or announcements of related projects use the Google Group.
- Report bugs, suggest features or view the source code on GitHub.
- To chat with developers and other users you can use the Gitter Chat
License and copyright
Cartopy is licensed under GNU Lesser General Public License (LGPLv3).
Development occurs on GitHub at https://github.com/SciTools/cartopy, with a contributor's license agreement (CLA) that can be found at http://scitools.org.uk/governance.html.
(C) British Crown Copyright, Met Office
Project details
Release history Release notifications | RSS feed
Download files
Download the file for your platform. If you're not sure which to choose, learn more about installing packages.
Source Distribution
Cartopy-0.17.0.tar.gz
(8.9 MB
view hashes)


