An stand alone, light-weight web server for building, sharing graphs in created in ipython. Let ipython do what it focus, let this do what everyone needs for building a interactive, collaborated and real-time streaming dashboards.

Project description


*Inspired by `IPython <http://ipython.org/>`__, built with love*
IPython-Dashboard
A stand alone, light-weight web server for building, sharing graphs created in IPython. Build for data science, data analysis guys. Aiming at building an interactive visualization, collaborated dashboard, and real-time streaming graph.
Usage
Install prerequisite
install the latest stable IPython-Dashboard: pip install ipython-dashboard --upgrade
install redis 2.6+ : install guide
install IPython-Dashboard requirements [unneeded sometimes]:
cd ~/your python package path/IPython-Dashboard
pip install -r requirements.txt
Config IPython-Dashboard server : ``IPython-Dashboard/dashboard/config.py``
app_host='ip_address:port'
Start redis and IPython-Dashboard server
chenshan@mac007:~/Desktop/github/IPython-Dashboard$redis-server &

chenshan@mac007:~/Desktop/github/IPython-Dashboard$dash-server --help
usage: dash-server [-h] [-H HOST] [-p PORT] [-d DEBUG]

Start your IPython-Dashboard server ...

optional arguments:
  -h, --help            show this help message and exit
  -H HOST, --host HOST  server host, default localhost
  -p PORT, --port PORT  server port, default 9090
  -d DEBUG, --debug DEBUG
                        server port, default true

chenshan@mac007:~/Desktop/github/IPython-Dashboard$dash-server
Namespace(debug=True, host='0.0.0.0', port=9090)
 * Running on http://0.0.0.0:9090/
 * Restarting with reloader
Namespace(debug=True, host='0.0.0.0', port=9090)
Do your exploring
*IPython-Dashboard-Tutorial.ipynb* : On nbviewer or On github
Goal
support raw html visualization
support python object visualization
Editable
Real-time fresh when rendering a variable python object
Can be shared, both public and private [ need password ]
In the notebook, can share an object to a dashboard [ that’s visualize that object in that dashboard ]
Use Case
exploring in notebook, share/send the result/summary to people, without the details.
share some data in a private notebook.
disappointed with the complicated code when drawing a graceful/staic graph using matplotlib/seaborn/mpld3 etc.
want an interactive graph, allow people to zoom in/out, resize, get hover tips, change graph type easily.
want a real-time graph.
want an collaborated graph/dashboard.

wise-choice
Screenshot and Demo
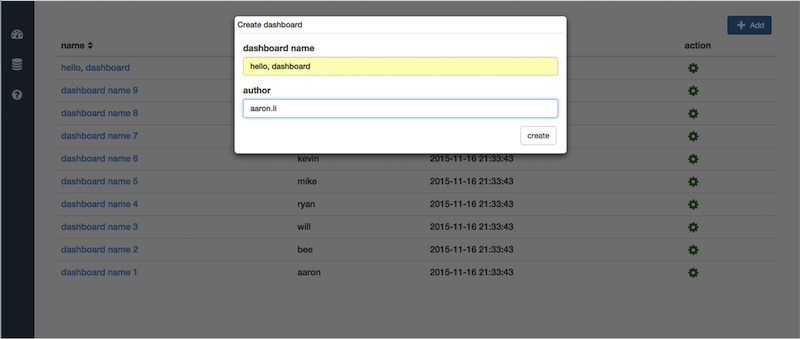
screenshot
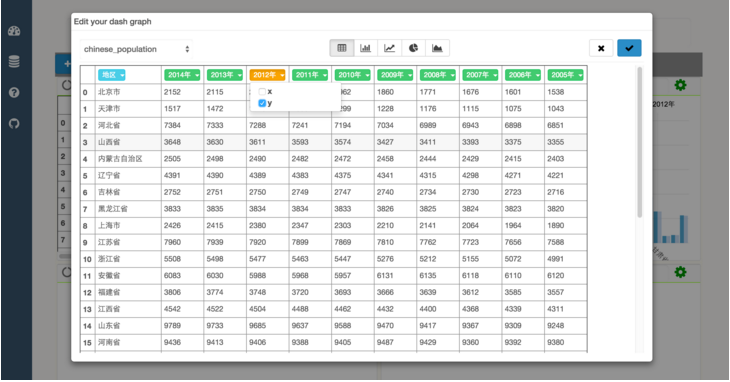
screenshot
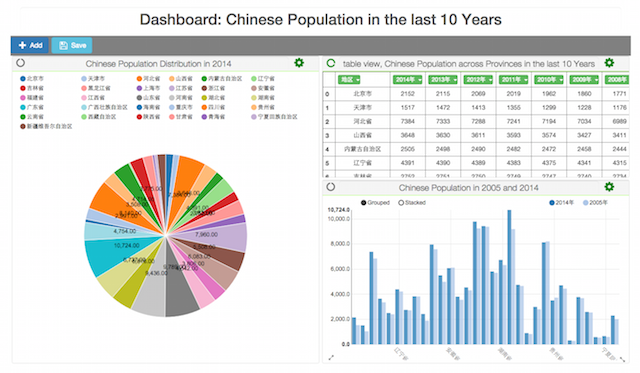
screenshot
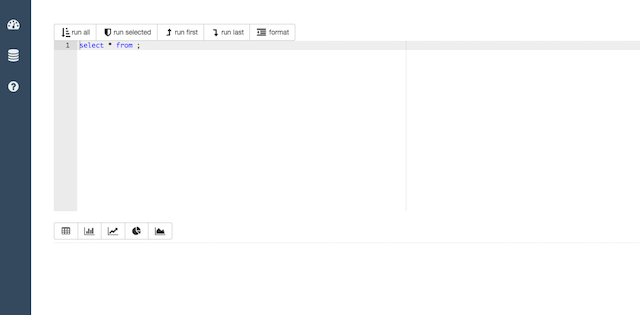
screenshot
Run tests
just run sudo nosetests --with-coverage --cover-package=dashboard under this repo
aaron@aarons-MacBook-Pro:~/Desktop/github/IPython-Dashboard$sudo nosetests --with-coverage --cover-package=dahboard
....
Name                                    Stmts   Miss  Cover   Missing
---------------------------------------------------------------------
dashboard.py                               11      0   100%
dashboard/client.py                         1      0   100%
dashboard/client/sender.py                 11      3    73%   26-27, 33
dashboard/config.py                        11      0   100%
dashboard/server.py                         1      0   100%
dashboard/server/resources.py               0      0   100%
dashboard/server/resources/dash.py         35     10    71%   55-56, 67-69, 82-89
dashboard/server/resources/home.py         40     12    70%   25, 28-30, 83-91
dashboard/server/resources/status.py        8      1    88%   19
dashboard/server/resources/storage.py      15      5    67%   28, 43-47
dashboard/server/utils.py                  31      6    81%   18-22, 29, 43
dashboard/server/views.py                  12      0   100%
---------------------------------------------------------------------
TOTAL                                     176     37    79%
----------------------------------------------------------------------
Ran 4 tests in 3.120s

OK
Change Log
future
front side, databricks style
pep 8, code clean up & restructure
hover tips
edit modal can be resized
Share one graph
Share one dashboard
Presentation mode
footer
unified message display center
SQL Editor
login management
unified logger and exception report
server side log
client side log
support python3
create examples
*V 0.1.5 : sql-server-log [ current develop version ]*
Dashboard
create 1 example
server side log
support x-axis as date format
research on real-time updated dataframe
SQL Editor
sql server develop : render sql result as table view
*V 0.1.4 : sql-ui-optimize : [ current stable release ]*
Dashboard
create 1 example
hover tips
unified message display
make the redis-server/dash-server configurable
SQL Editor
sql editor web UI.


Download files
Download the file for your platform. If you're not sure which to choose, learn more about installing packages.


