Automated exploratory data analysis (EDA).

Project description

Making Data Science Fun, One Color at a Time!


What is it?
ADIX is a free, open-source, color-customizable data analysis tool that simplifies Exploratory Data Analysis (EDA) with a single command ix.eda(). Experience a streamlined approach to uncovering insights, empowering you to focus on your data without distraction.
Color customization is at your fingertips, allowing you to tailor your analysis to your exact needs. Explore your data with confidence and efficiency, knowing that adix (Automatic Data Inspection and eXploration) has your back every step of the way.
⭐️ if you like the project, please consider giving it a star, thank you :)
Main Features
- Customizable Themes
- Spruce up the adix environment with your own personal touch by playing with color schemes!
- Eficient Cache Utilization
- Experience faster load times through optimized caching mechanisms, enhancing overall system performance.
- Rapid Data Insight
- adix prioritizes swiftly showcasing crucial data insights, ensuring quick access to important information.
- Automatic Type Detection
- Detects numerical, categorical, and text features automatically, with the option for manual overrides when necessary.
- Statistically Rich Summary Information:
- Unveil the intricate details of your data with a comprehensive summary, encompassing type identification, unique values, missing values, duplicate rows, the most frequent values and more.
- Delve deeper into numerical data, exploring properties like min-max range, quartiles, average, median, standard deviation, variance, sum, kurtosis, skewness and more.
- Univariate and Bivariate Statistics Unveiled
- Explore univariate and bivariate insights with adix's versatile visualization options. From bar charts to matrices, and box plots, uncover a multitude of ways to interpret and analyze your data effectively.
Documentation
Installation
The best way to install adix (other than from source) is to use pip:
pip install adix
adix is still under development If you encounter any data, compatibility, or installation issues, please don't hesitate to reach out!
Quick start
The system is designed for rapid visualization of target values and dataset, facilitating quick analysis of target characteristics with just one function ix.eda(). Similar to pandas' df.describe() function, it provides extended analysis capabilities, accommodating time-series and text data for comprehensive insights.
import adix as ix
from adix.datasets load_dataset

titanic = load_dataset('titanic')
10 minutes to adix
1. Rendering the whole dataframe
ix.eda(titanic)
- using forest color theme
2. Accesing variables of specific dtype
Render the DataFrame containing only categorical variables.
ix.eda(titanic,vars='categorical')
3. Accesing individual variables
ix.eda(titanic,'Age')
- using forest color theme
4. Pandas .loc & .iloc
An easy way to render only a part of the DataFrame you are interested in.
ix.eda(titanic.loc[:10:2,['Age','Pclass','Fare'])
5. Changing theme colors
ix.Configs.get_theme()
...
ix.Configs.set_theme('FOREST')

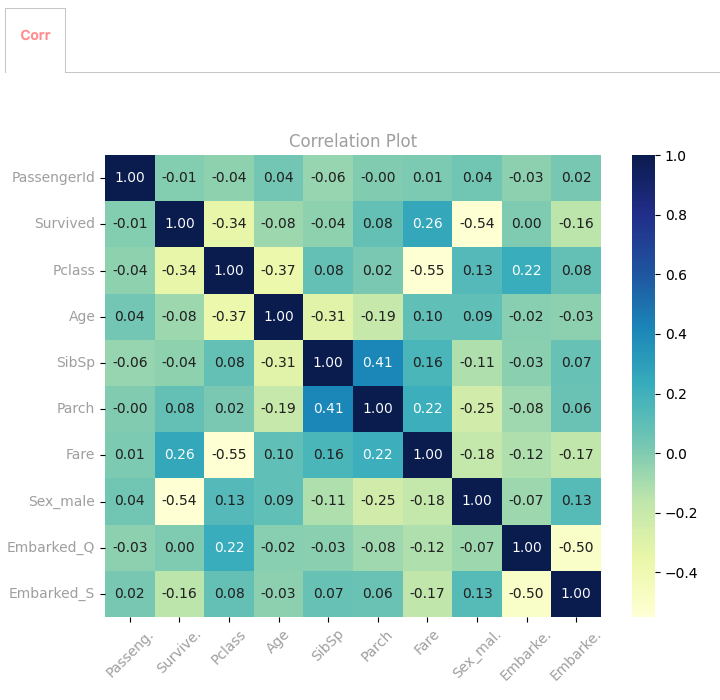
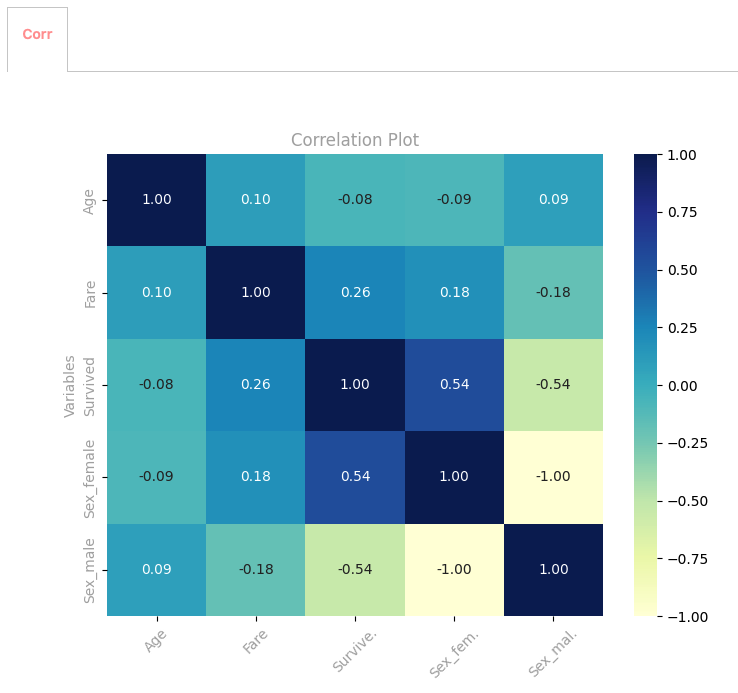
6. Heatmap correlation
This visualization depicts the correlation between all numerical variables within the DataFrame, offering valuable insights into the magnitude and direction of their relationships.
# Show correlation for the entire DataFrame.
ix.eda(titanic,corr=True)
Furthermore, it is possible to use categorical variables since they undergo one-hot encoding to enable their inclusion in correlation analysis. It's recommended to use ANOVA. You can choose whatever variables you want to explore and analyze.
# Show correlation for selected parts of the DataFrame
ix.eda(titanic.loc[:,['Age','Fare','Sex','Survived']],vars=['categorical','continuous'],corr=True)
7. Bivariate relationships: numerical & numerical
ix.eda(titanic,'Age','Fare')

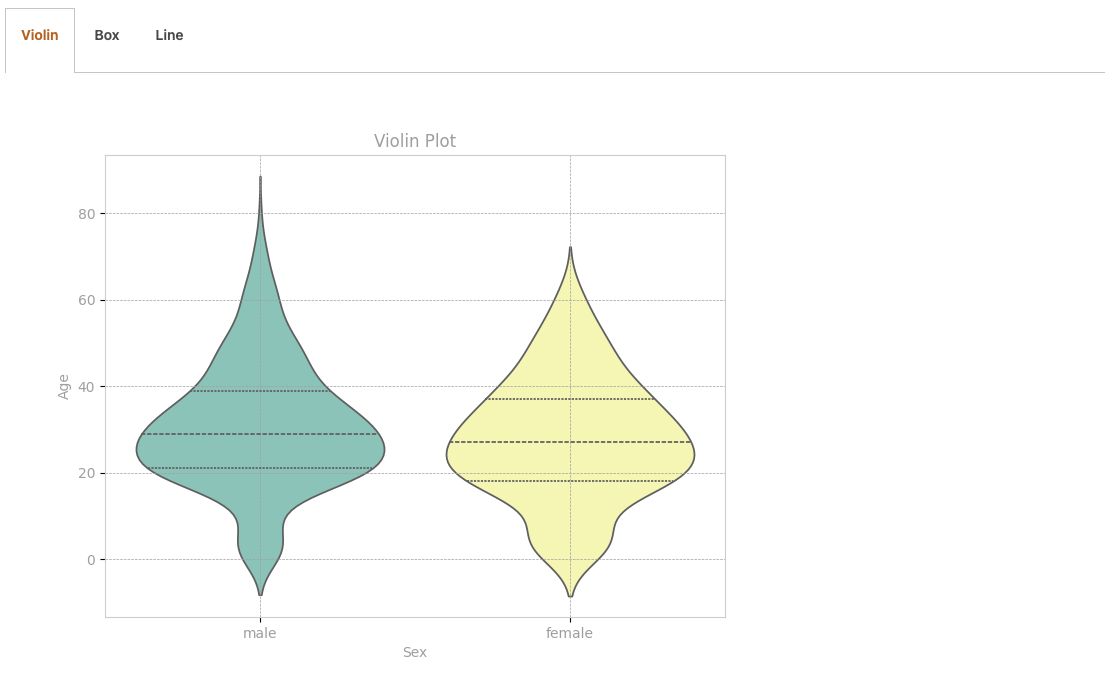
8. Bivariate relationships: categorical & numerical
ix.eda(titanic,'Sex','Age')
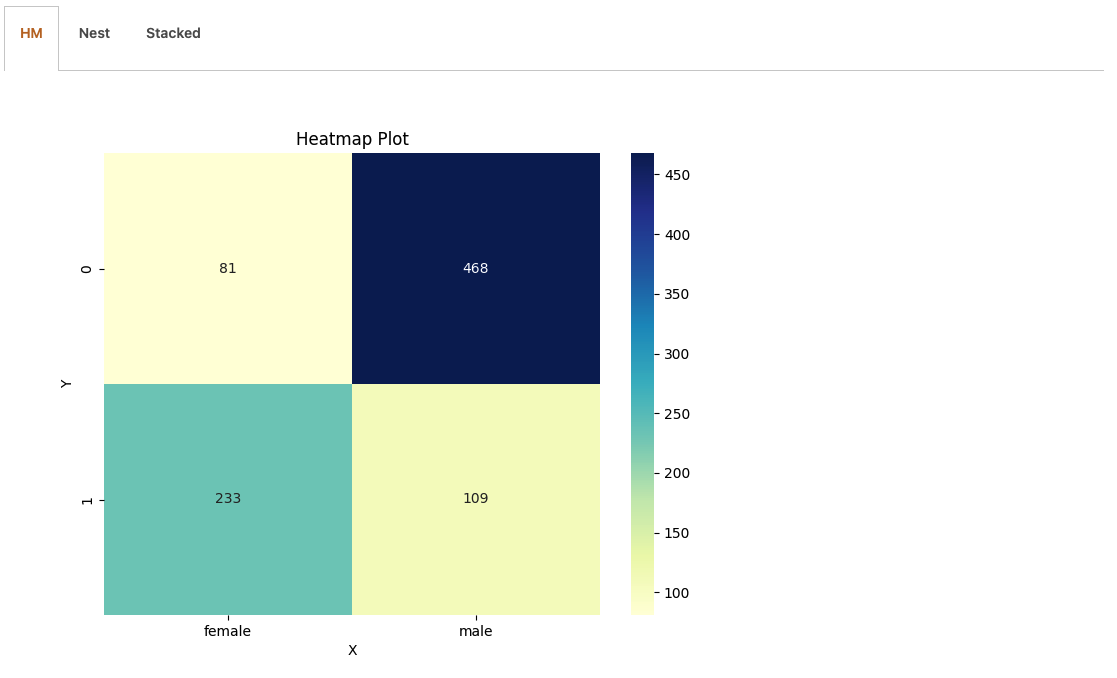
9. Bivariate relationships: categorical & categorical
ix.eda(titanic,'Sex','Survived')
License
MIT
Free Software, Hell Yeah!
Development
Contributions are welcome, so feel free to contact, open an issue, or submit a pull request!
For accessing the codebase or reporting bugs, please visit the GitHub repository.
This program is provided WITHOUT ANY WARRANTY. ADIX is still under heavy development and there might be hidden bugs.
Acknowledgement
The goal for adix is to make valuable information and visualization readily available in a user friendly environment at the click of a mouse, without reinventing the wheel. All of the libraries stated below are powerful and excellent alternatives to adix. Several functions of adix were inspired from the following:
- Sweetviz : The inception of this project found inspiration from Sweetviz, particularly its concept of consolidating all data in one place and using the blocks for individual features.
- Dataprep : Dataprep stands out as an excellent library for data preparation, and certain structural elements of adix have been inspired by it.
- Pandas-Profiling : Alerts served as inspiration for a segment of the dashboard's design, contributing to its functionality and user-friendly features."
- Kaggle source of Titanic dataset
Release history Release notifications | RSS feed


Download files
Download the file for your platform. If you're not sure which to choose, learn more about installing packages.


