Peace-wise interpolation and lazy evaluation in cython

Project description
BPF4

About
bpf4 is a library for curve fitting and break-point functions in python. It is mainly programmed in Cython for efficiency.
Documentation
The documentation is hosted at https://bpf4.readthedocs.io
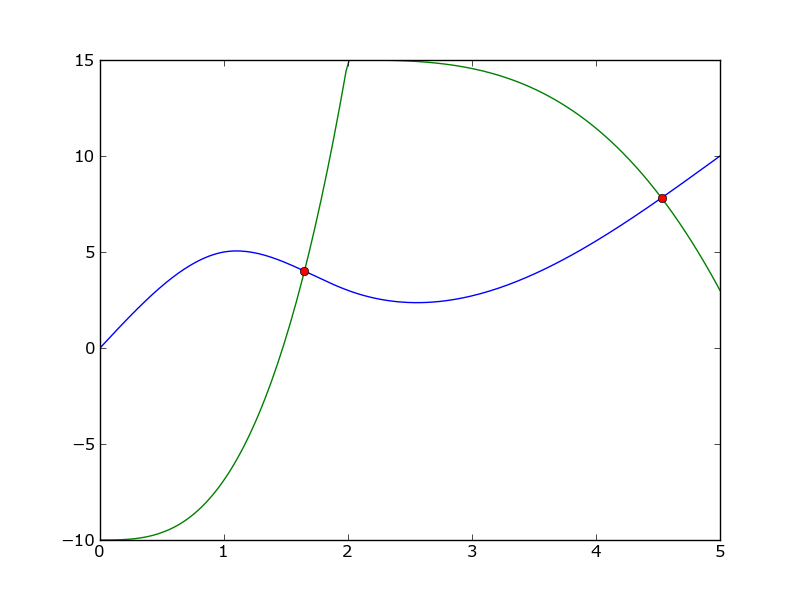
Example
Find the intersection between two curves
from bpf4 import bpf  # this imports the api
a = bpf.spline((0, 0), (1, 5), (2, 3), (5, 10))  # each point (x, y)
b = bpf.expon((0, -10), (2,15), (5, 3), exp=3)
a.plot() # uses matplotlib
b.plot()
zeros = (a - b).zeros()
import pylab
pylab.plot(zeros, a.map(zeros), 'o')
Features
Many interpolation types besides linear:
- spline
- half-cosine
- exponential
- fibonacci
- exponantial half-cosine
- pchip
- logarithmic
- etc.
Interpolation types can be mixed, so that each segment has a different interpolation (with the exception of spline interpolation)
Curves can be combined non-destructively. Following from the example above.
c = (a + b).sin().abs()
c[1.5:4].plot()  # plot only the range (1.5, 4)
Syntax support for shifting, scaling and slicing a bpf
a >> 2        # a shifted to the right
(a * 5) ^ 2   # scale the x coord by 2, scale the y coord by 5
a[2:2.5]      # slice only a portion of the bpf
a[::0.01]     # sample the bpf with an interval of 0.01
- Derivation and Integration:
c.derivative().plot()orc.integrated().integrated().plot() - Numerical integration:
c.integrate_between(2, 4)
Installation
pip install --upgrade bpf4
To install from source:
git clone https://github.com/gesellkammer/bpf4.git
cd bpf4
pip install .
Mathematical operations
Max / Min
a = linear(0, 0, 1, 0.5, 2, 0)
b = expon(0, 0, 2, 1, exp=3)
a.plot(show=False, color="red", linewidth=4, alpha=0.3)
b.plot(show=False, color="blue", linewidth=4, alpha=0.3)
core.Max((a, b)).plot(color="black", linewidth=4, alpha=0.8, linestyle='dotted')

a = linear(0, 0, 1, 0.5, 2, 0)
b = expon(0, 0, 2, 1, exp=3)
a.plot(show=False, color="red", linewidth=4, alpha=0.3)
b.plot(show=False, color="blue", linewidth=4, alpha=0.3)
core.Min((a, b)).plot(color="black", linewidth=4, alpha=0.8, linestyle='dotted')

+, -, *, /
a = linear(0, 0, 1, 0.5, 2, 0)
b = expon(0, 0, 2, 1, exp=3)
a.plot(show=False, color="red", linewidth=4, alpha=0.3)
b.plot(show=False, color="blue", linewidth=4, alpha=0.3)
(a*b).plot(color="black", linewidth=4, alpha=0.8, linestyle='dotted')

a = linear(0, 0, 1, 0.5, 2, 0)
b = expon(0, 0, 2, 1, exp=3)
a.plot(show=False, color="red", linewidth=4, alpha=0.3)
b.plot(show=False, color="blue", linewidth=4, alpha=0.3)
(a**b).plot(color="black", linewidth=4, alpha=0.8, linestyle='dotted')

a = linear(0, 0, 1, 0.5, 2, 0)
b = expon(0, 0, 2, 1, exp=3)
a.plot(show=False, color="red", linewidth=4, alpha=0.3)
b.plot(show=False, color="blue", linewidth=4, alpha=0.3)
((a+b)/2).plot(color="black", linewidth=4, alpha=0.8, linestyle='dotted')

Building functions
A bpf can be used to build complex formulas
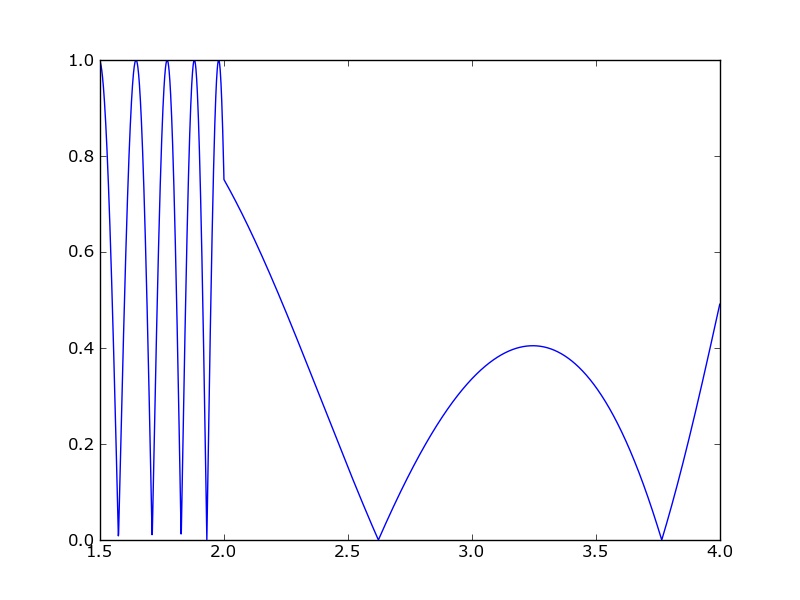
Fresnel's Integral: ( S(x) = \int_0^x {sin(t^2)} dt )
t = slope(1)
f = (t**2).sin()[0:10:0.001].integrated()
f.plot()

Polar plots
Any kind of matplotlib plot can be used. For example, polar plots are possible
by creating an axes with polar=True
Cardiod: (\rho = 1 + sin(-\theta) )
from math import *
theta = slope(1, bounds=(0, 2*pi))
r = 1 + (-theta).sin()

ax = plt.axes(polar=True)
ax.set_rticks([0.5, 1, 1.5, 2]); ax.set_rlabel_position(38)
r.plot(axes=ax)

Flower 5: (\rho = 3 + cos(5 * \theta) )
theta = core.Slope(1, bounds=(0, 2*pi))
r = 3 + (5*theta).cos()

ax = plt.axes(polar=True)
r.plot(axes=ax)

Release history Release notifications | RSS feed


Download files
Download the file for your platform. If you're not sure which to choose, learn more about installing packages.
Source Distribution
Built Distributions
Hashes for bpf4-1.5.1-cp310-cp310-win_amd64.whl
| Algorithm | Hash digest | |
|---|---|---|
| SHA256 | 5a730256fee730dce092198e20e66ce7c8236daaab75d2f648a39fd82c4e2111 |
|
| MD5 | 69427e1284fad4c3bae257950e345cb7 |
|
| BLAKE2b-256 | 9a068fb7b783db65e78ef8921e84f3e4f67a84c7c42ddbe1a2672f83702e80d6 |
Hashes for bpf4-1.5.1-cp310-cp310-win32.whl
| Algorithm | Hash digest | |
|---|---|---|
| SHA256 | 3289dbb9b85ce39886119803d76a7c58e3bba83aeb2f7931ffbf4f0eb5a3ed84 |
|
| MD5 | d7a21a04a3b71f9d784991e89b6694e2 |
|
| BLAKE2b-256 | a2385734a700f03735336941c9e5d4c6c12c52451927d08d044a02f6282642f2 |
Hashes for bpf4-1.5.1-cp310-cp310-manylinux_2_17_x86_64.manylinux2014_x86_64.whl
| Algorithm | Hash digest | |
|---|---|---|
| SHA256 | 6a133c56ef71065202a69c12f4be848f9f23b10f453f67f23995607309fcd8a1 |
|
| MD5 | 280d5b6305b4628f6eed5a2756cedaa5 |
|
| BLAKE2b-256 | 5a7423754d68a13fcbee7752b467219da06651f2abdee2378da21c1f01bc42c6 |
Hashes for bpf4-1.5.1-cp310-cp310-macosx_10_9_x86_64.whl
| Algorithm | Hash digest | |
|---|---|---|
| SHA256 | 127d5b373ee77c0f00796711049dd30f7c0938e5e4d1708144f78d087f9006a3 |
|
| MD5 | 5e8bd36bb46a34ace54927bd82f703d3 |
|
| BLAKE2b-256 | 2b2b7c9eb5f438431fd2201677b2de215220db7587d517c690ffbc616fd86700 |
Hashes for bpf4-1.5.1-cp39-cp39-win_amd64.whl
| Algorithm | Hash digest | |
|---|---|---|
| SHA256 | 5f75cf5f0a5668fde4ee30af15b1bb8079dce41c344f441febcd491ec1c8f3df |
|
| MD5 | 0ed3a1c1828897222f9b9c6a8862507f |
|
| BLAKE2b-256 | 7c7a8c22595280425409a01bbcecd213ecf54b0263bc7e425d6d6a4aa9f60f0d |
Hashes for bpf4-1.5.1-cp39-cp39-manylinux_2_17_x86_64.manylinux2014_x86_64.whl
| Algorithm | Hash digest | |
|---|---|---|
| SHA256 | 668c9643c42724ea34ac59b165d18342bc8ef5cd2b4b1f445abd904c77dbad25 |
|
| MD5 | d0eee9905bec7d5665f7fe5bd0eec009 |
|
| BLAKE2b-256 | 32223158eaf0d7d5e982ae9b6ad4c8ecc916e6de11e1dc5ed8756188652c6add |
Hashes for bpf4-1.5.1-cp39-cp39-macosx_10_9_x86_64.whl
| Algorithm | Hash digest | |
|---|---|---|
| SHA256 | 9560a5cb1bb55cacece7c27a354c2acf43974a680e7f381e438138c6ba7976d1 |
|
| MD5 | d4196359fff7dd3f9adbf919c39bf964 |
|
| BLAKE2b-256 | 385f2c3069066cced31b305491f810486e71e177a5334778d5713db44d99ae05 |
Hashes for bpf4-1.5.1-cp38-cp38-win_amd64.whl
| Algorithm | Hash digest | |
|---|---|---|
| SHA256 | 5bb190b5eeaa3d7a98298b7ff57a04e889533052634df26d3571ce08793f2891 |
|
| MD5 | e543cb4fd7250d568c1c9e1c8a668dc0 |
|
| BLAKE2b-256 | 1fbe06da85f4c27769eb2559380cfd313379ef7becb3c529aaa6e51127e52702 |
Hashes for bpf4-1.5.1-cp38-cp38-manylinux_2_17_x86_64.manylinux2014_x86_64.whl
| Algorithm | Hash digest | |
|---|---|---|
| SHA256 | 4faa10a9e489e37b74356e6769658a6f1abfd2d39c7fe10d331f28f697e14921 |
|
| MD5 | 7b34e1e9aa480ffc8f05a2073e2da5c0 |
|
| BLAKE2b-256 | c0f13a8d7b62606b8b751df8045e67c0a40e1f11361937375ba00ec3ac42c467 |
Hashes for bpf4-1.5.1-cp38-cp38-macosx_10_9_x86_64.whl
| Algorithm | Hash digest | |
|---|---|---|
| SHA256 | b619c00d51f3071d01b7e24c9c3c59d754c8d1697487a153726b2f94bcca7a81 |
|
| MD5 | c49d65d41403c401db0e578881099578 |
|
| BLAKE2b-256 | 519d49984037c2388c5fa48a3f6609da4d21f4f5e262f284381559fda35823f1 |


