DataLab (CDL) is a data processing and analysis software for scientific and industrial applications


Project description


ℹ️ Created by Codra/Pierre Raybaut in 2023, developed and maintained by DataLab open-source project team with the support of Codra.
ℹ️ DataLab is powered by PlotPyStack 🚀.

Overview
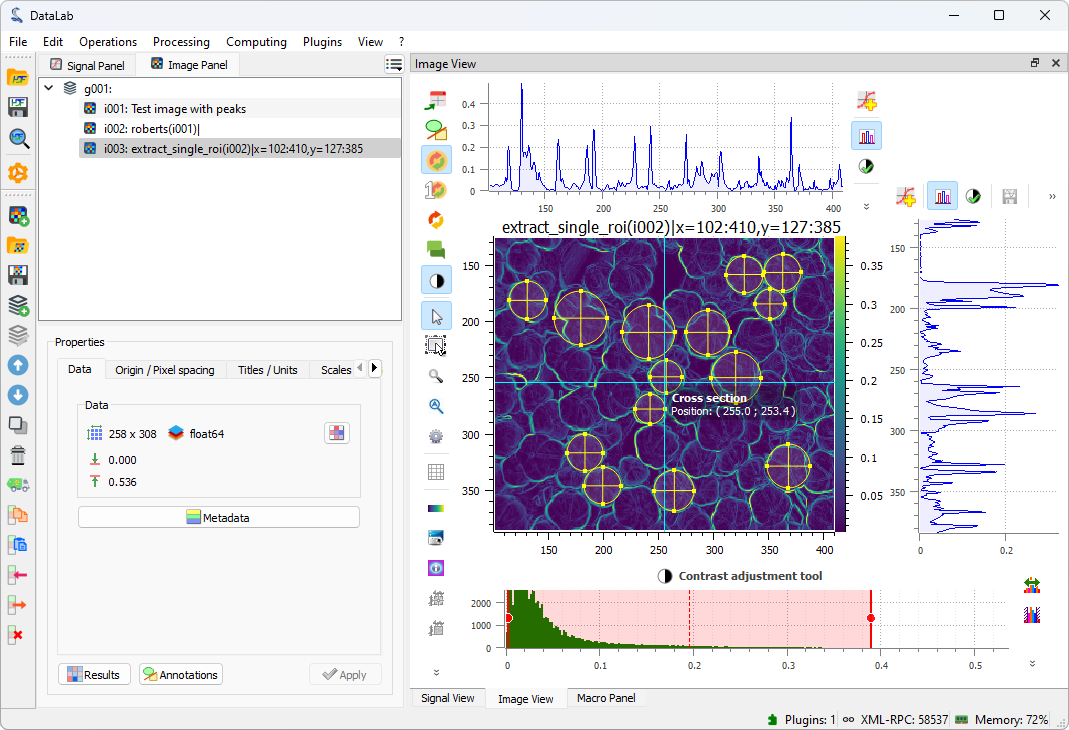
DataLab is a generic signal and image processing software based on Python scientific libraries (such as NumPy, SciPy or scikit-image) and Qt graphical user interfaces (thanks to the powerful PlotPyStack - mostly the guidata and PlotPy libraries).
DataLab is available as a stand-alone application (see for example our all-in-one Windows installer) or as an addon to your Python-Qt application thanks to advanced automation and embedding features.
✨ DataLab may be remotely controlled from a third-party application (such as Jupyter, Spyder or any IDE):
-
Using the integrated remote control feature (this requires to install on your environment DataLab as a Python package and all its dependencies)
-
Using the lightweight DataLab Simple Client (
pip install cdlclient)
See home page and documentation for more details on the library and changelog for recent history of changes.
New in DataLab 0.9
New key features in DataLab 0.9:
- New process isolation feature to run computations safely in a separate process
- New remote control features to interact with DataLab from Spyder, Jupyter or any IDE
- New remote control features to run computations with DataLab from a third-party application
- New data processing and visualization features (see details in changelog)
- Fully automated high-level processing features for internal testing purpose, as well as embedding DataLab in a third-party software
- Extensive test suite (unit tests and application tests) with >80% feature coverage
Credits
Copyrights and licensing:
- Copyright © 2023 Codra, Pierre Raybaut.
- Licensed under the terms of the BSD 3-Clause (see LICENSE).
Key features
Data visualization
| Signal | Image | Feature |
|---|---|---|
| • | • | Screenshots (save, copy) |
| • | Z-axis | Lin/log scales |
| • | • | Data table editing |
| • | • | Statistics on user-defined ROI |
| • | • | Markers |
| • | Aspect ratio (1:1, custom) | |
| • | 50+ available colormaps | |
| • | X/Y raw/averaged profiles | |
| • | • | User-defined annotations |
Data processing
| Signal | Image | Feature |
|---|---|---|
| • | • | Process isolation (for runnning computations) |
| • | • | Remote control from Jupyter, Spyder or any IDE |
| • | • | Remote control from a third-party application |
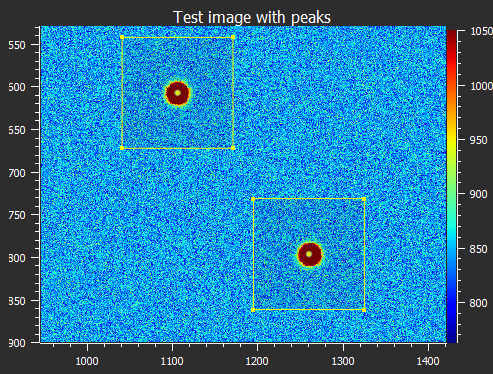
| • | • | Multiple ROI support |
| • | • | Sum, average, difference, product, ... |
| • | • | ROI extraction, Swap X/Y axes |
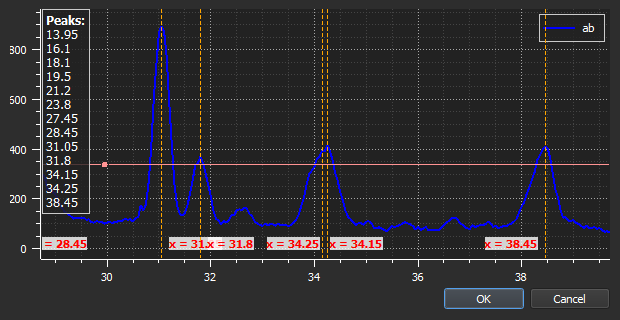
| • | Semi-automatic multi-peak detection | |
| • | Rotation (flip, rotate), resize, ... | |
| • | Flat-field correction | |
| • | Normalize, derivative, integral | |
| • | • | Linear calibration |
| • | Thresholding, clipping | |
| • | • | Gaussian filter, Wiener filter |
| • | • | Moving average, moving median |
| • | • | FFT, inverse FFT |
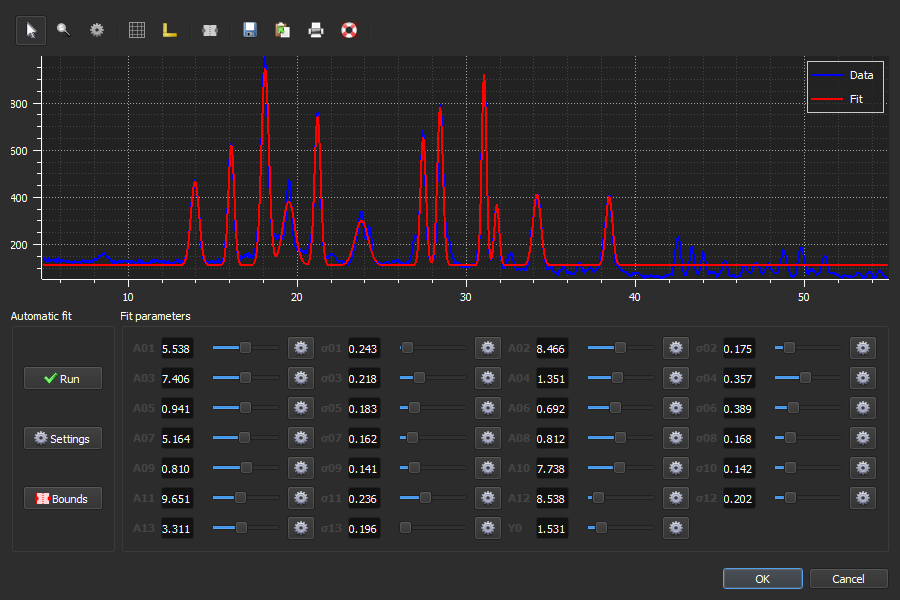
| • | Interactive fit: Gauss, Lorenzt, Voigt, polynomial | |
| • | Interactive multigaussian fit | |
| • | • | Computing on custom ROI |
| • | FWHM, FW @ 1/e² | |
| • | Centroid (robust method w/r noise) | |
| • | Minimum enclosing circle center | |
| • | Automatic 2D-peak detection | |
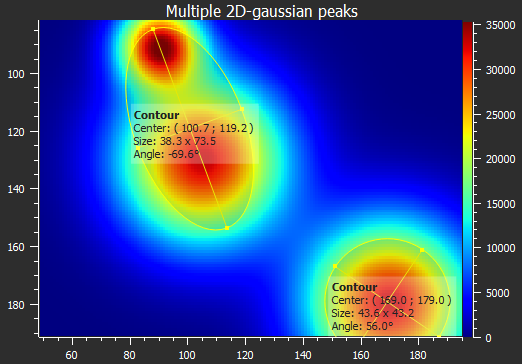
| • | Automatic contour extraction (circle/ellipse fit) |
Installation
From the installer
DataLab is available as a stand-alone application, which does not require any Python distribution to be installed. Just run the installer and you're good to go!
The installer package is available in the Releases section.
Dependencies and other installation methods
See Installation section in the documentation for more details.
Release history Release notifications | RSS feed


Download files
Download the file for your platform. If you're not sure which to choose, learn more about installing packages.


