A declarative drawing API

Project description

Chalk is a declarative drawing library built on top of PyCairo. The API draws heavy inspiration from Haskell's diagrams, Scala's doodle and Jeremy Gibbons's lecture notes on Functional Programming for Domain−Specific Languages.
⚠️ The library is still very much work in progress and subject to change.
Installation
The library is available on PyPI as chalk-diagrams and can be installed with pip:
pip install chalk-diagrams
If you want to use the LaTeX extension, run:
pip install chalk-diagrams[latex]
For the LaTeX extension you might need to install pdf2svg and texlive;
on Debian these dependencies can be installed as follows:
sudo apt-get install pdf2svg texlive texlive-science texlive-latex-recommended texlive-latex-extra
Overview
Below we provide a brief introduction of the main functionality of the library.
These examples are available in the examples/intro.py file.
We start by importing the colour module and the diagrams functions:
from colour import Color
from chalk import *
We also define some colors that will be shortly used:
papaya = Color("#ff9700")
blue = Color("#005FDB")
We can easily create basic shapes (the functions circle, square, triangle) and style them with various attributes (the methodsfill_color, line_color, line_width).
For example:
d = circle(1).fill_color(papaya)

The diagram can be saved to an image using the render method:
d.render("examples/output/intro-01.png", height=64)
We can glue together two diagrams using the combinators atop (or +), beside (or |), above (or /).
For example:
circle(2).fill_color(papaya) | square(1).fill_color(blue)
which is equivalent to
circle(2).fill_color(papaya).beside(square(1).fill_color(blue))
This code produces the following image:

We also provide combinators for a list of diagrams:
hcat for horizontal composition, vcat for vertical composition.
For example:
hcat(circle(0.1 * i) for i in range(1, 6)).fill_color(blue)

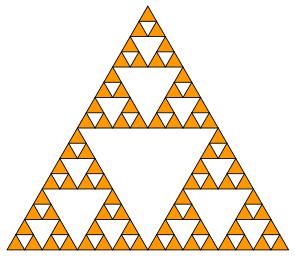
We can use Python functions to build more intricate diagrams:
def sierpinski(n: int, size: int) -> Diagram:
    if n <= 1:
        return triangle(size)
    else:
        smaller = sierpinski(n - 1, size / 2)
        return smaller.above(smaller.beside(smaller).center_xy())

d = sierpinski(5, 4).fill_color(papaya)
For more examples, please check the examples folder.
These scripts can be run as follows:
python examples/squares.py
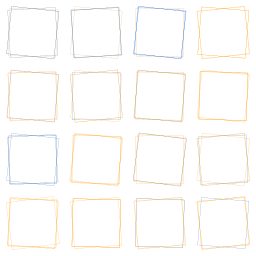
python examples/escher_square_limit.py

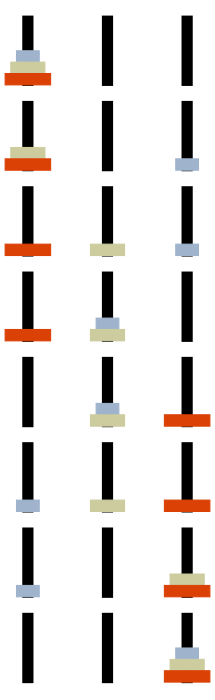
python examples/hanoi.py
Authors
Special thanks to Ionuț G. Stan for providing many useful insights and comments!
Release history Release notifications | RSS feed


Download files
Download the file for your platform. If you're not sure which to choose, learn more about installing packages.
Source Distribution
Built Distribution
Hashes for chalk_diagrams-0.1.2-py3-none-any.whl
| Algorithm | Hash digest | |
|---|---|---|
| SHA256 | 6321ae93bd2f87065b7b1b758265b7646fcee9a0e2c81d2df82b001df770b6f6 |
|
| MD5 | 60adf67769ebc6fef12e37d9f36a9ec5 |
|
| BLAKE2b-256 | a9ff1b33313207aa5715cf9cb543a171b069a9ae189da97a7f58acf0fd88ea3e |


