Population-based Forward-time Simulator for the Outbreak of COVID-19

Project description
# COVID-19 Outbreak Simulator
The COVID-19 outbreak simulator simulates the outbreak of COVID-19 in a population. It was first designed to simulate the outbreak of COVID-19 in small populations in enclosed environments, such as a FPSO (floating production storage and offloading vessel) but it is being expanded to simulate much larger populations with dynamic parameters.
## Background
This simulator simulates the scenario in which
A group of individuals in a population in which everyone is susceptible
One virus carrier is introduced to the population, potentially after a fixed days of self-quarantine.
Infectees are by default removed from from the population (or separated, or quarantined, as long as he or she can no longer infect others) after they displayed symptoms, but options are provided to act otherwise.
The simulator simulates the epidemic of the population with the introduction of an infector. The following questions can be answered:
What is the expected day and distribution for the first person to show symptoms?
How many people are expected to be removed once an outbreak starts?
How effective will self-quarantine before dispatch personnels to an enclosed environment?
The simulator uses the latest knowledge about the spread of COVID-19 and is validated against public data. This project will be contantly updated with our deepening knowledge on this virus.
## How to use the simulator
This simulator is programmed using Python >= 3.6 with numpy and scipy. A conda environment is recommended. After the set up of the environment, please run
` pip install -r requirements.txt `
to install required packages, and then
` pip install covid19-outbreak-simulator `
to install the package.
You can then use command
` outbreak_simulator -h `
to check the usage information.
## Output from the simulator
The output file contains events that happens during the simulations. For example, for command
` outbreak_simulator --repeat 100 --popsize 64 --logfile result_remove_symptomatic.txt `
You will get an output file result_remove_symptomatic.txt with the following columns:
Currently the following events are tracked
The log file of a typical simulation would look like the following:
` id time event target params 1 0.00 INFECTION 0 r0=0.53,r=0,r_asym=0 1 0.00 END 64 popsize=64,prop_asym=0.276 2 0.00 INFECTION 0 r0=2.42,r=1,r_presym=1,r_sym=0,incu=5.51 2 4.10 INFECTION 62 by=0,r0=1.60,r=2,r_presym=2,r_sym=0,incu=5.84 2 5.51 SHOW_SYMPTOM 0 . 2 5.51 REMOVAL 0 popsize=63 2 9.59 INFECTION 9 by=62,r0=2.13,r=2,r_presym=2,r_sym=0,incu=3.34 2 9.84 INFECTION_IGNORED 9 by=62 2 9.94 SHOW_SYMPTOM 62 . 2 9.94 REMOVAL 62 popsize=62 2 10.76 INFECTION 30 by=9,r0=1.96,r=2,r_presym=2,r_sym=0,incu=4.85 2 11.64 INFECTION 57 by=9,r0=0.39,r=0,r_asym=0 2 12.23 INFECTION 56 by=30,r0=1.65,r=1,r_presym=1,r_sym=0,incu=4.26 2 12.93 SHOW_SYMPTOM 9 . 2 12.93 REMOVAL 9 popsize=61 2 14.37 INFECTION 6 by=30,r0=1.60,r=0,r_presym=0,r_sym=0,incu=2.63 2 15.61 SHOW_SYMPTOM 30 . 2 15.61 REMOVAL 30 popsize=60 2 16.37 INFECTION 1 by=56,r0=1.57,r=1,r_presym=1,r_sym=0,incu=5.14 2 16.49 SHOW_SYMPTOM 56 . 2 16.49 REMOVAL 56 popsize=59 2 16.99 SHOW_SYMPTOM 6 . 2 16.99 REMOVAL 6 popsize=58 2 18.42 INFECTION 8 by=1,r0=2.45,r=1,r_presym=1,r_sym=0,incu=3.74 2 20.35 INFECTION 44 by=8,r0=2.37,r=1,r_presym=1,r_sym=0,incu=3.92 2 21.51 SHOW_SYMPTOM 1 . 2 21.51 REMOVAL 1 popsize=57 2 22.16 SHOW_SYMPTOM 8 . 2 22.16 REMOVAL 8 popsize=56 2 22.62 INFECTION 42 by=44,r0=1.49,r=0,r_presym=0,r_sym=0,incu=4.30 2 24.27 SHOW_SYMPTOM 44 . 2 24.27 REMOVAL 44 popsize=55 2 26.92 SHOW_SYMPTOM 42 . 2 26.92 REMOVAL 42 popsize=54 2 26.92 END 54 popsize=54,prop_asym=0.216 3 0.00 INFECTION 0 r0=2.00,r=2,r_presym=2,r_sym=0,incu=4.19 `
which I assume would be pretty self-explanatory.
## Summary report from multiple replicates
At the end of each command, a report will be given to summarize key statistics from multiple replicated simulations. The output contains the following keys and their values
## Data analysis tools
Because all the events have been recorded in the log files, it should not be too difficult for you to write your own script (e.g. in R) to analyze them and produce nice figures. We however made a small number of tools available. Please feel free to submit or own script for inclusion in the contrib library.
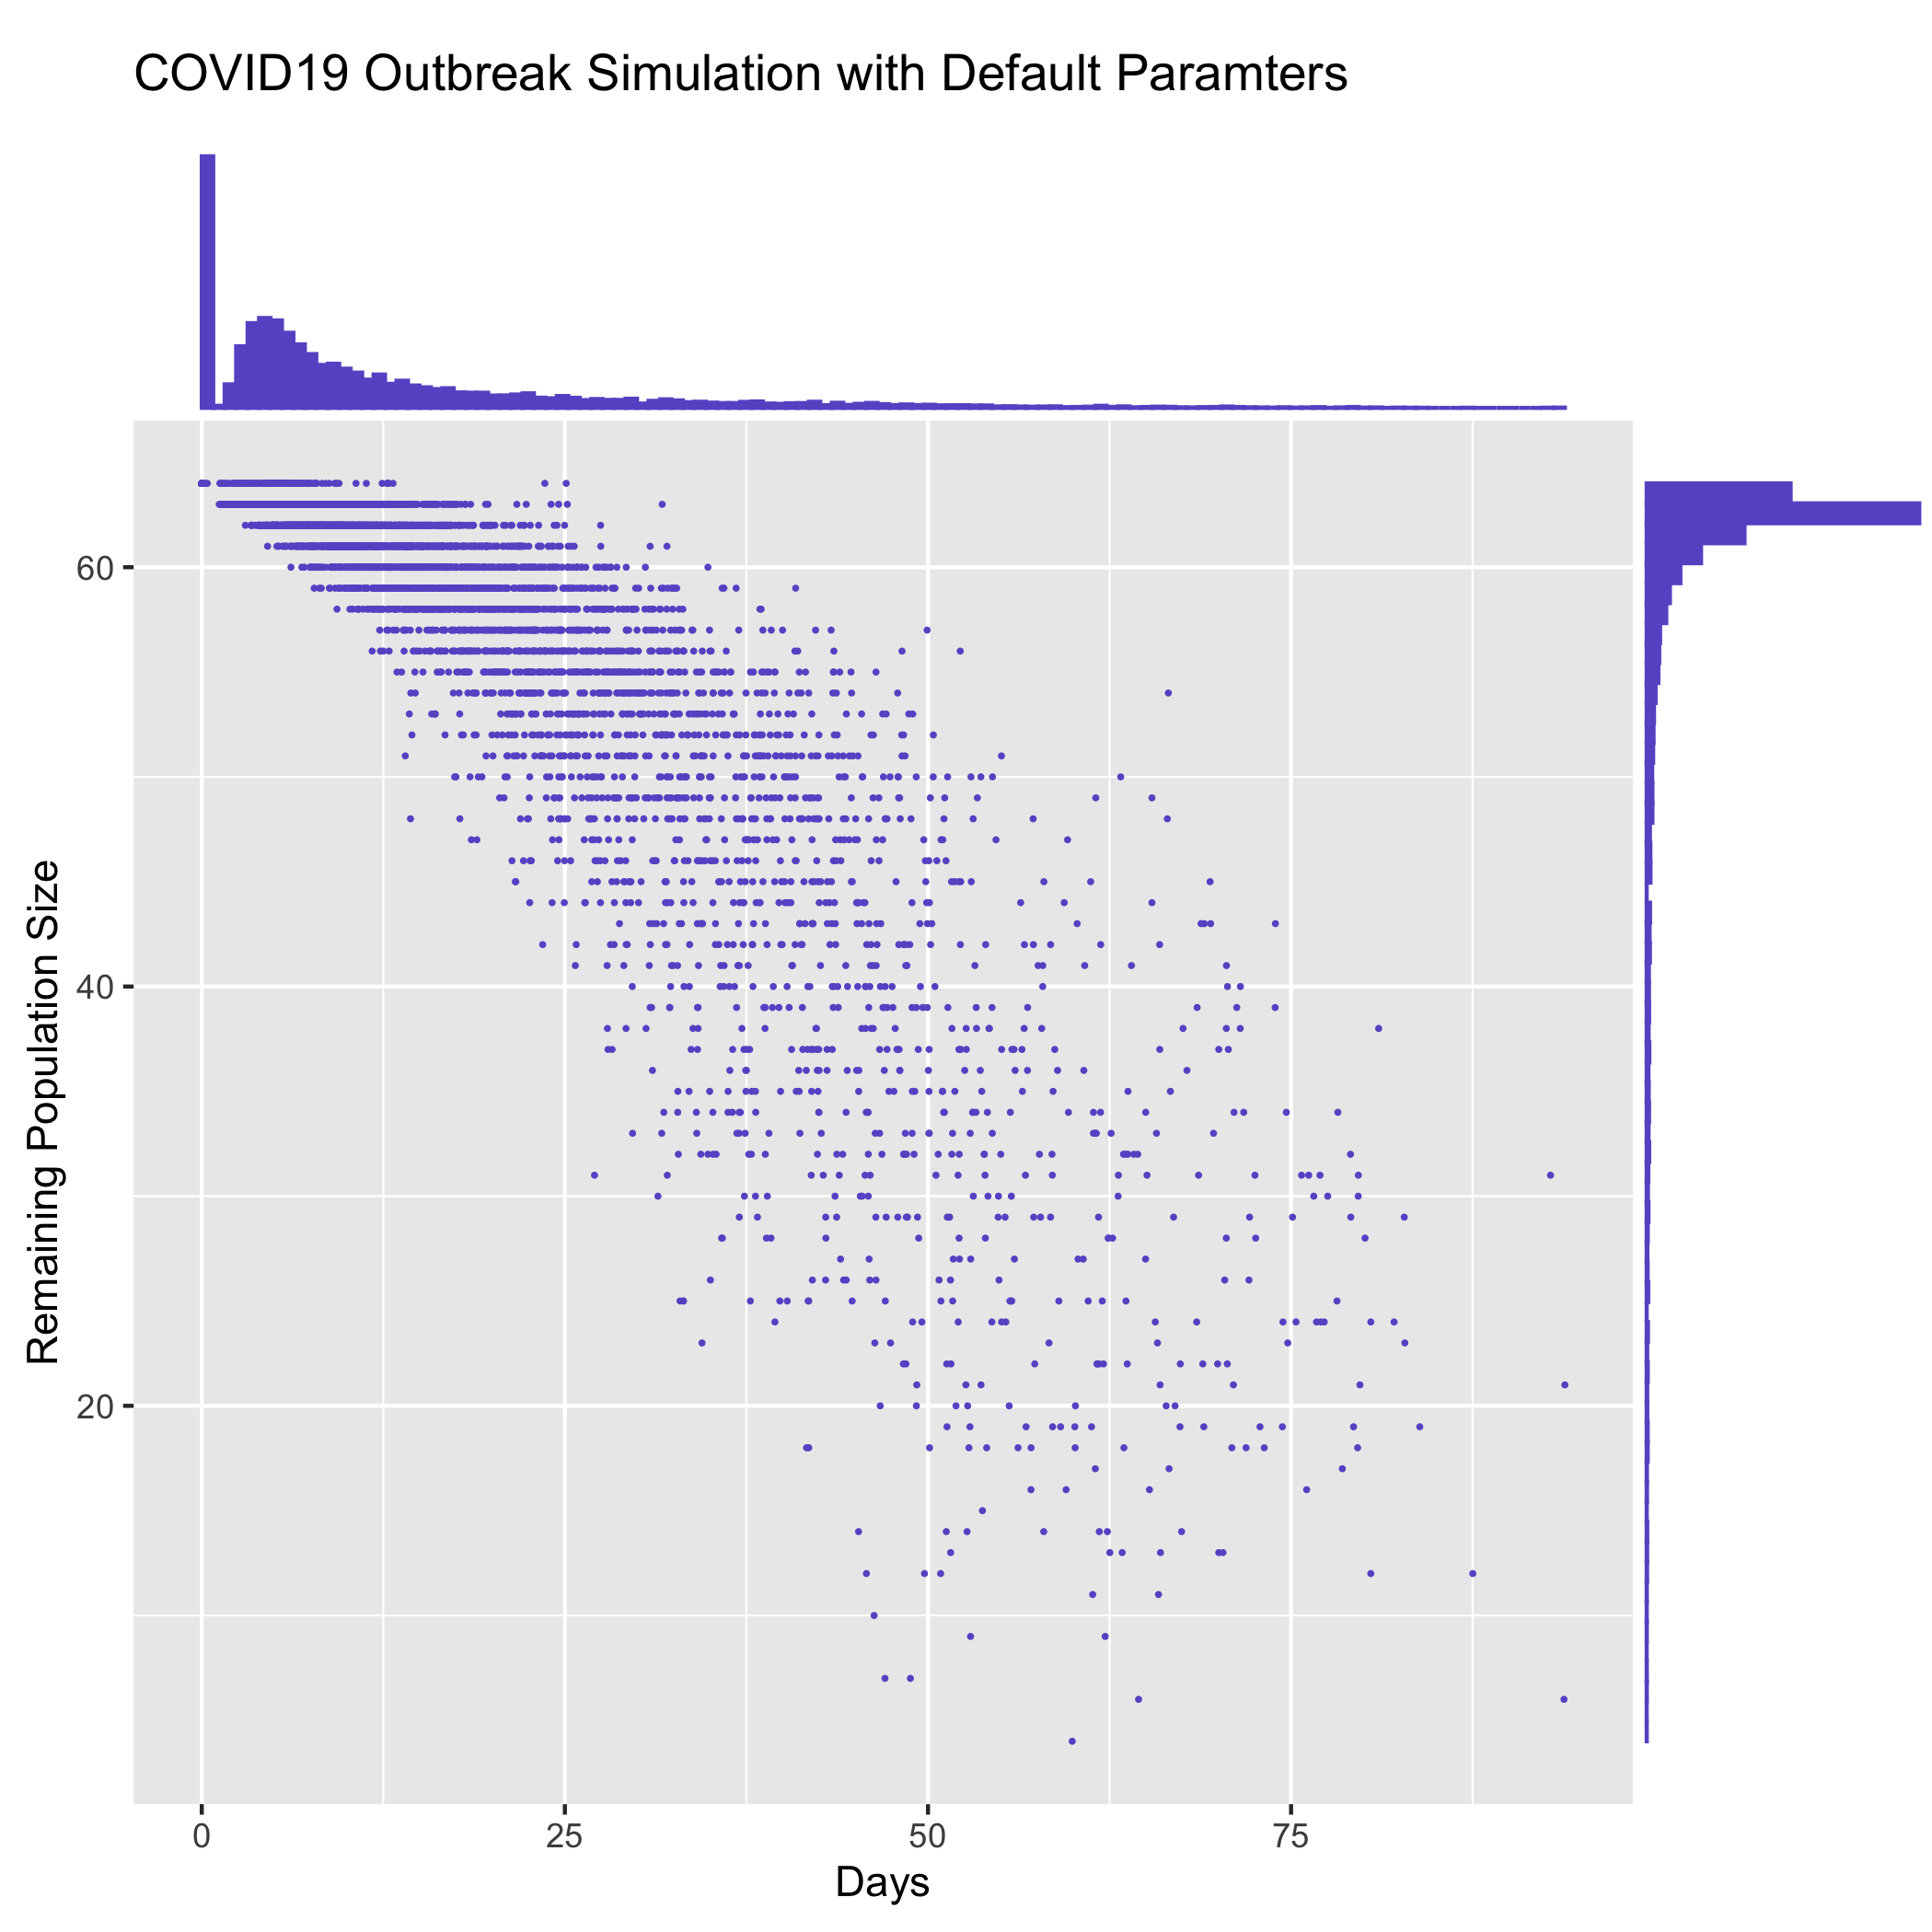
### time_vs_size.R
The [contrib/time_vs_size.R](https://github.com/ictr/covid19-outbreak-simulator/blob/master/contrib/time_vs_size.R) script provides an example on how to process the data and produce a figure. It can be used as follows:
` Rscript time_vs_size.R simulation.log 'COVID19 Outbreak Simulation with Default Paramters' time_vs_size.png `
and produces a figure
### merge_summary.py
[contrib/merge_summary.py](https://github.com/ictr/covid19-outbreak-simulator/blob/master/contrib/merge_summary.py) is a script to merge summary stats from multiple simulation runs.
## Acknowledgements
This tool has been developed and maintained by Dr. Bo Peng, associate professor at the Baylor College of Medicine, with guidance from Dr. Christopher Amos, from the [Institute for Clinical and Translational Research, Baylor College of Medicine](https://www.bcm.edu/research/office-of-research/clinical-and-translational-research). Contributions to this project are welcome. Please refer to the [LICENSE](https://github.com/ictr/outbreak_simulator/blob/master/LICENSE) file for proper use and distribution of this tool.
This package was created with [Cookiecutter](https://github.com/audreyr/cookiecutter) and the [audreyr/cookiecutter-pypackage](https://github.com/audreyr/cookiecutter-pypackage) project template.
Release history Release notifications | RSS feed


Download files
Download the file for your platform. If you're not sure which to choose, learn more about installing packages.
Source Distribution
Built Distribution
Hashes for covid19-outbreak-simulator-0.1.0.tar.gz
| Algorithm | Hash digest | |
|---|---|---|
| SHA256 | 8bde05a12189596589c78328dcda580c557e9259392f5f25b7e3247b8f60efb2 |
|
| MD5 | e9b6a543ce7dd00dc420d4b0da415d9a |
|
| BLAKE2b-256 | 15c4950df16d6077751ad5141630babe55dadffdfdf5db5b86617b13b230f350 |
Hashes for covid19_outbreak_simulator-0.1.0-py2.py3-none-any.whl
| Algorithm | Hash digest | |
|---|---|---|
| SHA256 | 27d52671b1978efe194d4088a49386ac4476972879a40ffdb151520b331356ec |
|
| MD5 | e73c04c33d1c98e8ee5e728f15599ef1 |
|
| BLAKE2b-256 | ba78ce756b9df4ab04937c2635bcdfea780e486298490dc52212586c1a5cdcc9 |


