Plotting tools for complex-valued functions

Project description
cplot
Plotting complex-valued functions.


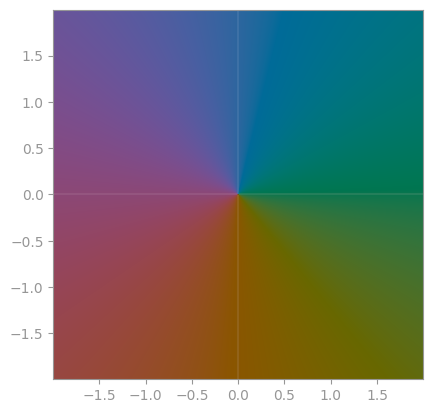
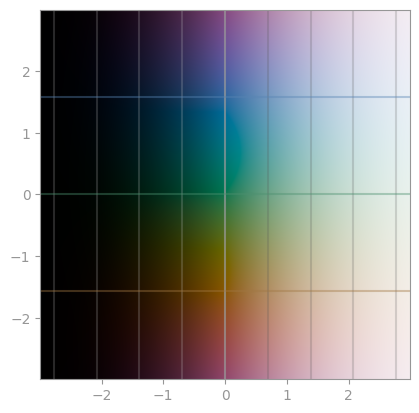
cplot is an attempt at encoding complex-valued data in colors. The general idea is to map the absolute value to lightness and the complex argument (the "angle") to the chroma of the representing color. This follows the domain coloring approach with the colors taken from the CAM16 to avoid perceptual distortion. (It has been claimed that this leads to drab images, but the examples below prove the contrary.)
The representation is chosen such that
- values around 0 are black,
- values around infinity are white,
- values around +1 are teal,
- values around -1 are orange-red,
- values around +i are purple, and
- values around -i are yellow-green.
With this, it is easy to see where a function has very small and very large values, and the multiplicty of zeros and poles is instantly identified by counting the color wheel passes around a black or white point.
See below for examples with some well-known functions.
import cplot
import numpy

cplot.show(numpy.tan, -5, +5, -5, +5, 100, 100)

# There is a tripcolor function as well for triangulated 2D domains
# cplot.tripcolor(triang, z)
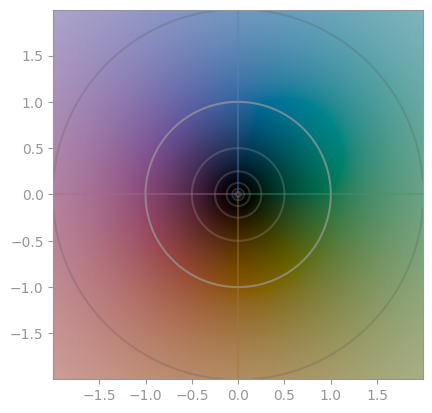
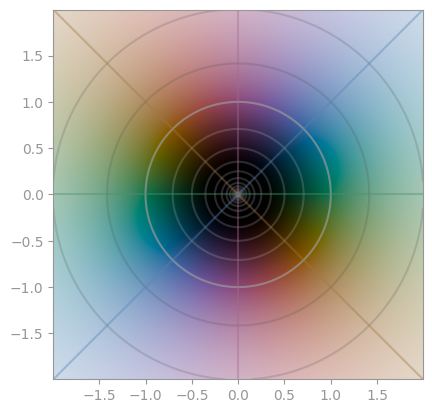
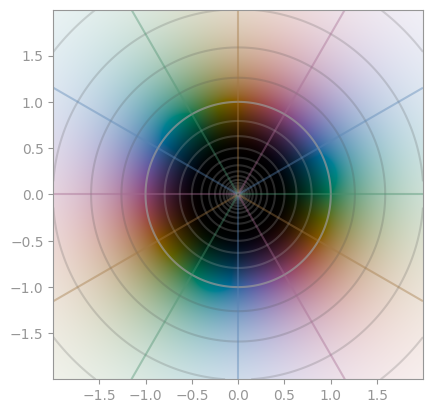
z**1 | z**2 | z**3 |
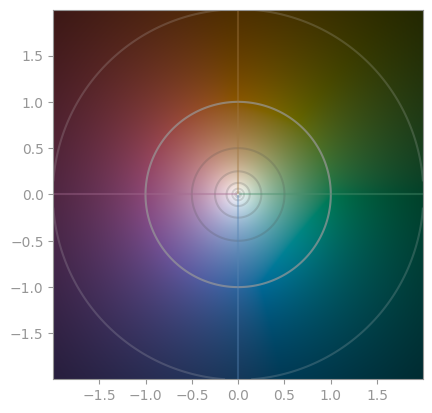
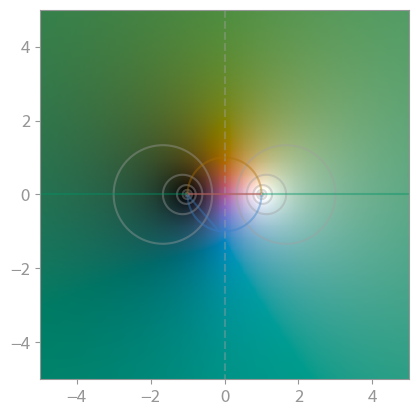
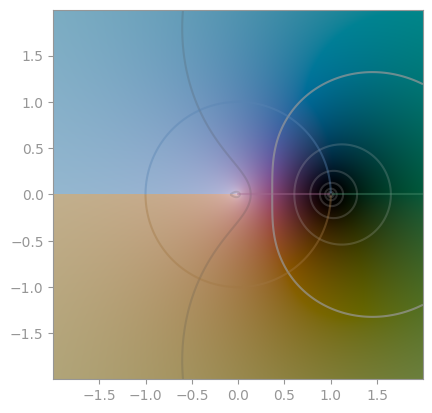
1/z | z / abs(z) | (z+1) / (z-1) |
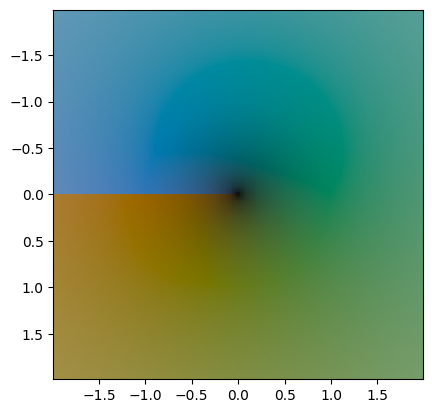
numpy.sqrt | numpy.log | numpy.exp |
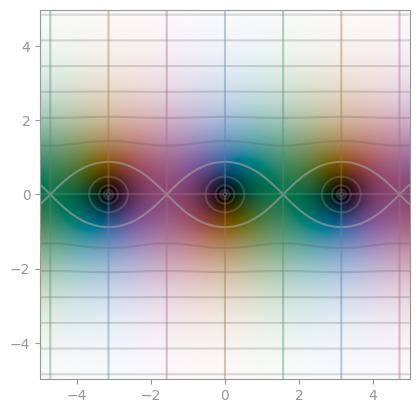
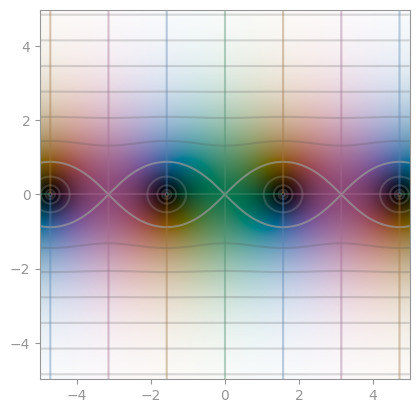
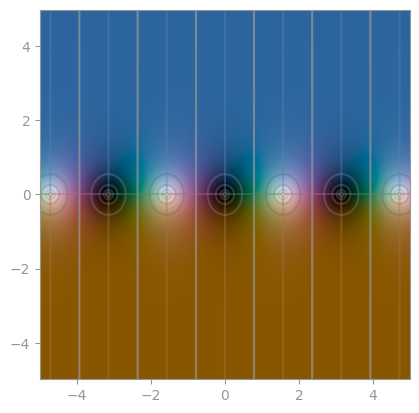
numpy.sin | numpy.cos | numpy.tan |
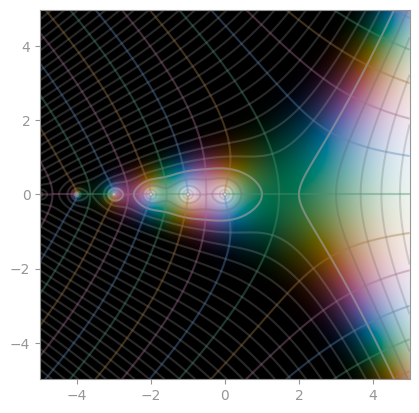
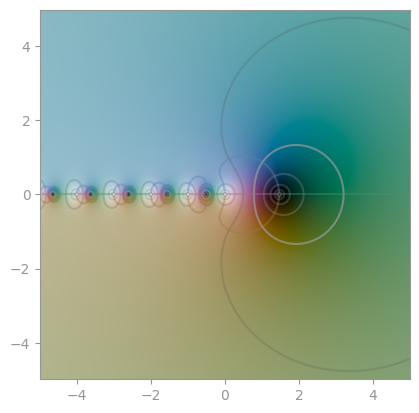
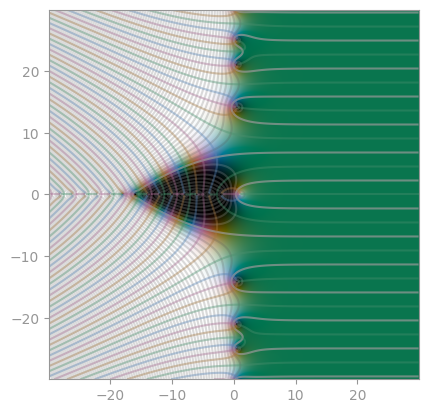
scipy.special.gamma | scipy.special.digamma | mpmath.zeta |
Testing
To run the cplot unit tests, check out this repository and type
pytest
Distribution
To create a new release
-
bump the
__version__number, -
tag and upload to PyPi:
make publish
License
cplot is published under the MIT license.
Release history Release notifications | RSS feed


Download files
Download the file for your platform. If you're not sure which to choose, learn more about installing packages.
Source Distribution
Built Distribution
Hashes for cplot-0.1.1-py2.py3-none-any.whl
| Algorithm | Hash digest | |
|---|---|---|
| SHA256 | a38be555db0ee492b0b619f9fdca7db4143861e08e68a10ec8a711d9bc8d5620 |
|
| MD5 | dc3321026221e2463afa05887a86f2e6 |
|
| BLAKE2b-256 | 4045e681f34582952a1b8233046685b6fc0ea0fd0bd1cbb8b37a62f8339c454e |


