Datasette plugin that shows a cluster map for any data with latitude/longitude columns

Project description
datasette-cluster-map
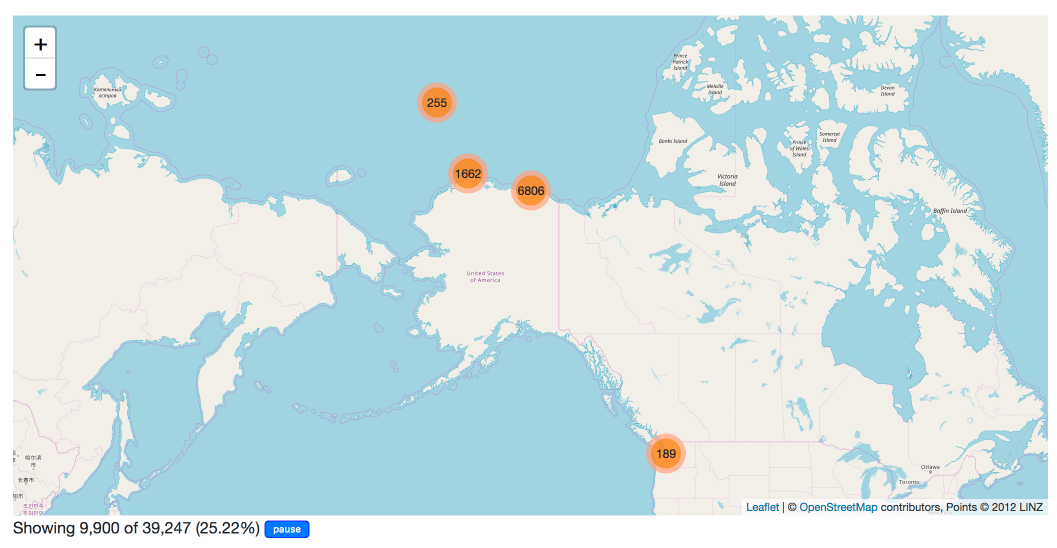
A Datasette plugin that detects tables with latitude and longitude columns and then plots them on a map using Leaflet.markercluster.
Demo
https://datasette-cluster-map-demo.now.sh/ hosts a demo of this plugin running against several different tables.
Installation
Run pip install datasette-cluster-map to add this plugin to your Datasette virtual environment. Datasette will automatically include the plugin if it is installed in this way.
If you are deploying using the datasette publish command you can use the --install option:
datasette publish now mydb.db --install=datasette-cluster-map
If any of your tables have a latitude and longitude column, a map will be automatically displayed.
If you columns are called something else you can still get the map to display by using a custom SQL query to alias those columns to latitude and longitude, for example:
select *, "Capture Latitude" as latitude, "Capture Longitude" as longitude
from [USGS_WC_eartag_deployments_2009-2011]
How I deployed the demo
I deploy this demo using the latest master versions of both datasette and datasette-cluster-map like so:
datasette publish now --branch=master \
    --install=https://github.com/simonw/datasette-cluster-map/archive/master.zip \
    --extra-options "--page_size=500" \
    --name="datasette-cluster-map-demo" \
    polar-bears.db sf-trees.db
Release history Release notifications | RSS feed


Download files
Download the file for your platform. If you're not sure which to choose, learn more about installing packages.
Source Distribution
Hashes for datasette-cluster-map-0.4.tar.gz
| Algorithm | Hash digest | |
|---|---|---|
| SHA256 | 9a37d5abe6ccabee9a9ba283065a1e674b3921d12fbbc94297c05e5cb8eaa8fc |
|
| MD5 | ba9fceeef2bb71f32a96af80762793cd |
|
| BLAKE2b-256 | b398a88b5d89ed5a20707f6b64f71fb47d6005b3824a61fb596ddd41de8385bd |


