dfvue: A minimal GUI for a quick view of csv files

Project description
A simple GUI to view csv files


About dfvue
dfvue is a minimal GUI for a quick view of csv files. It uses an input panel similar to Excel to check visually that the csv file is read correctly. It provides most options of pandas’ read_csv method to be very versatile on the possible csv format.
dfvue is a Python script that can be called from within Python or as a command line tool. It is not supposed to produce publication-ready plots but rather provide a quick overview of the csv file.
The complete documentation for dfvue is available from:
Quick usage guide
dfvue can be run from the command line:
dfvue csv_file.csvor from within Python:
from dfvue import dfvue
dfvue('csv_file.csv')
where the csv file is optional. The latter can be left out and a csv file can be opened with the “Open File” button from within dfvue.
Note, dfvue uses the TkAgg backend of matplotlib. It must be called before any other call to matplotlib. This also means that you cannot launch it from within iPython if it was launched with –pylab. It can be called from within a standard iPython, though, or using ipython –gui tk.
General layout
On opening, dfvue presents currently only one panel for producing scatter/line plots. This is the look in macOS light mode (higher resolution images can be found in the documentation):
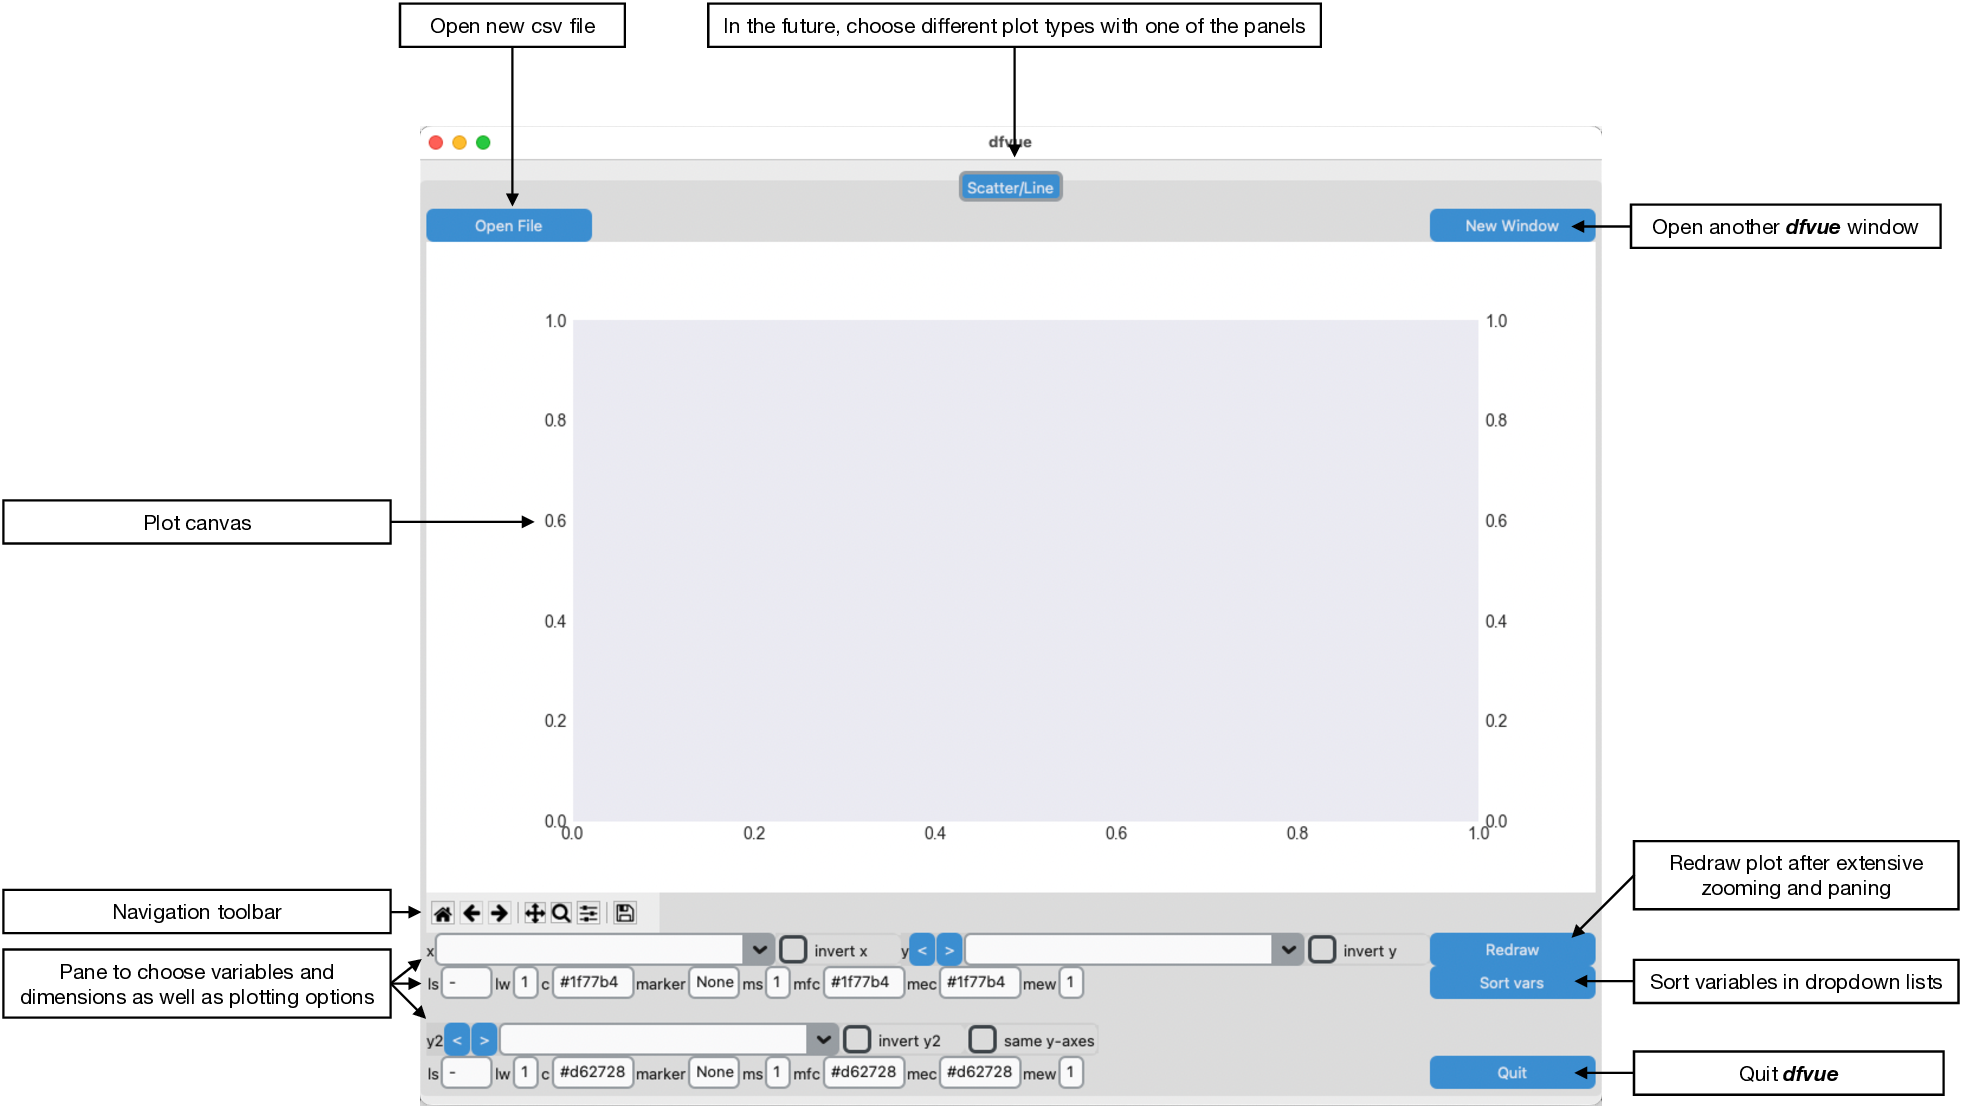
The pane is organised in this fashion: the plotting canvas, the Matplotlib navigation toolbar and the pane, where one can choose the plotting variables and plotting options. You can open another, identical window for the same csv file with the button “New Window” on the top right. You can then also read in a new csv file in one of the windows with the button “Open File”.
Reading a csv file
The “Read csv file” window opens when a csv file is given.
The csv file can be given on the command line:
dfvue csv_file.csvfrom within Python:
from dfvue import dfvue
dfvue('csv_file.csv')
or being selected from the “Choose csv file” selector that opens when hitting the button “Open File”.
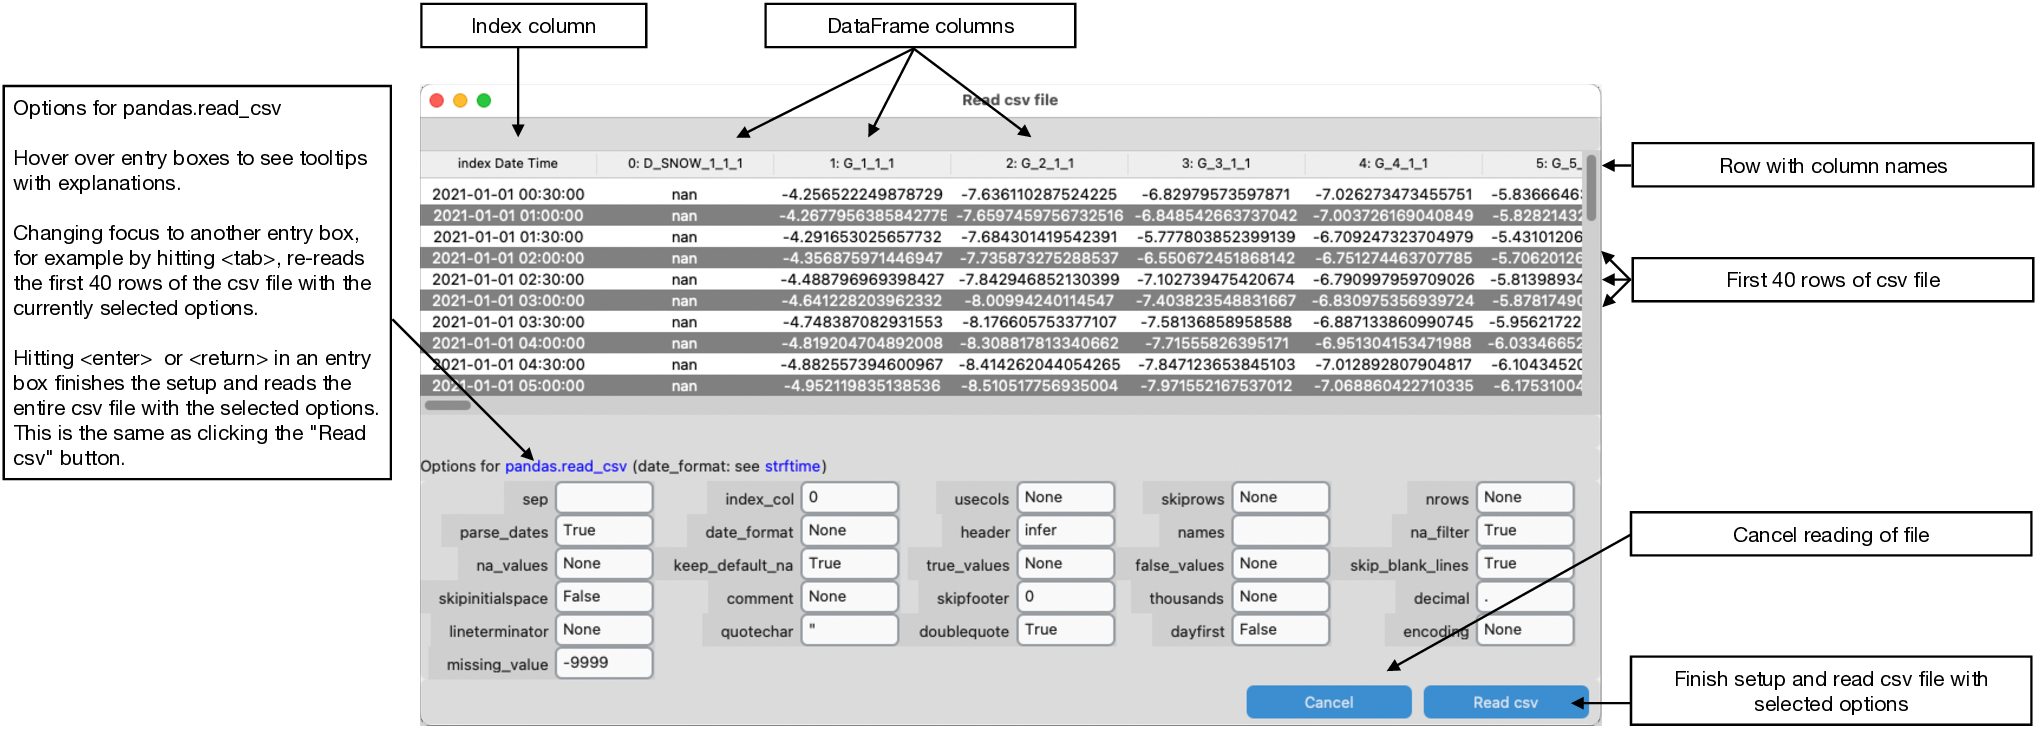
The “Read csv file” window reads the first 40 rows of the csv file with pandas’ read_csv method using the options given in the pane. It shows the resulting pandas.DataFrame in tabulated format. Changing focus from one option entry to another, for example by hitting the <tab> key, re-reads the first 40 rows of the csv file with pandas.read_csv using the selected options in the form. Hitting <enter> or <return> within the window reads the entire csv file using the selected options and returns to the plotting panels. This is the same than pressing the “Read csv” button in the lower right corner.
The options in the form are pandas’ read_csv default options except for parse_date, which is set to True instead of False here. Hover over the entry boxes to see explanations of the options in the tooltip.
If the csv file includes a Date/Time column, it is best to set this column as the index of the pandas.DataFrame by using index_col. Correct datetime is indicated if the index has the data type datetime64[ns] in the plot panels. This is then correctly interpreted by the underlying Matplotlib when plotting, zooming, or panning the axes. dfvue sets the index if index_col is used but also provides the original column.
missing_value is not an option of pandas’ read_csv. It is here for convenience and any number entered in missing_value will be added to pandas na_values.
Scatter/Line panel
Here is the Scatter/Line panel in macOS dark mode, describing all buttons, sliders, entry boxes, spinboxes, and menus:
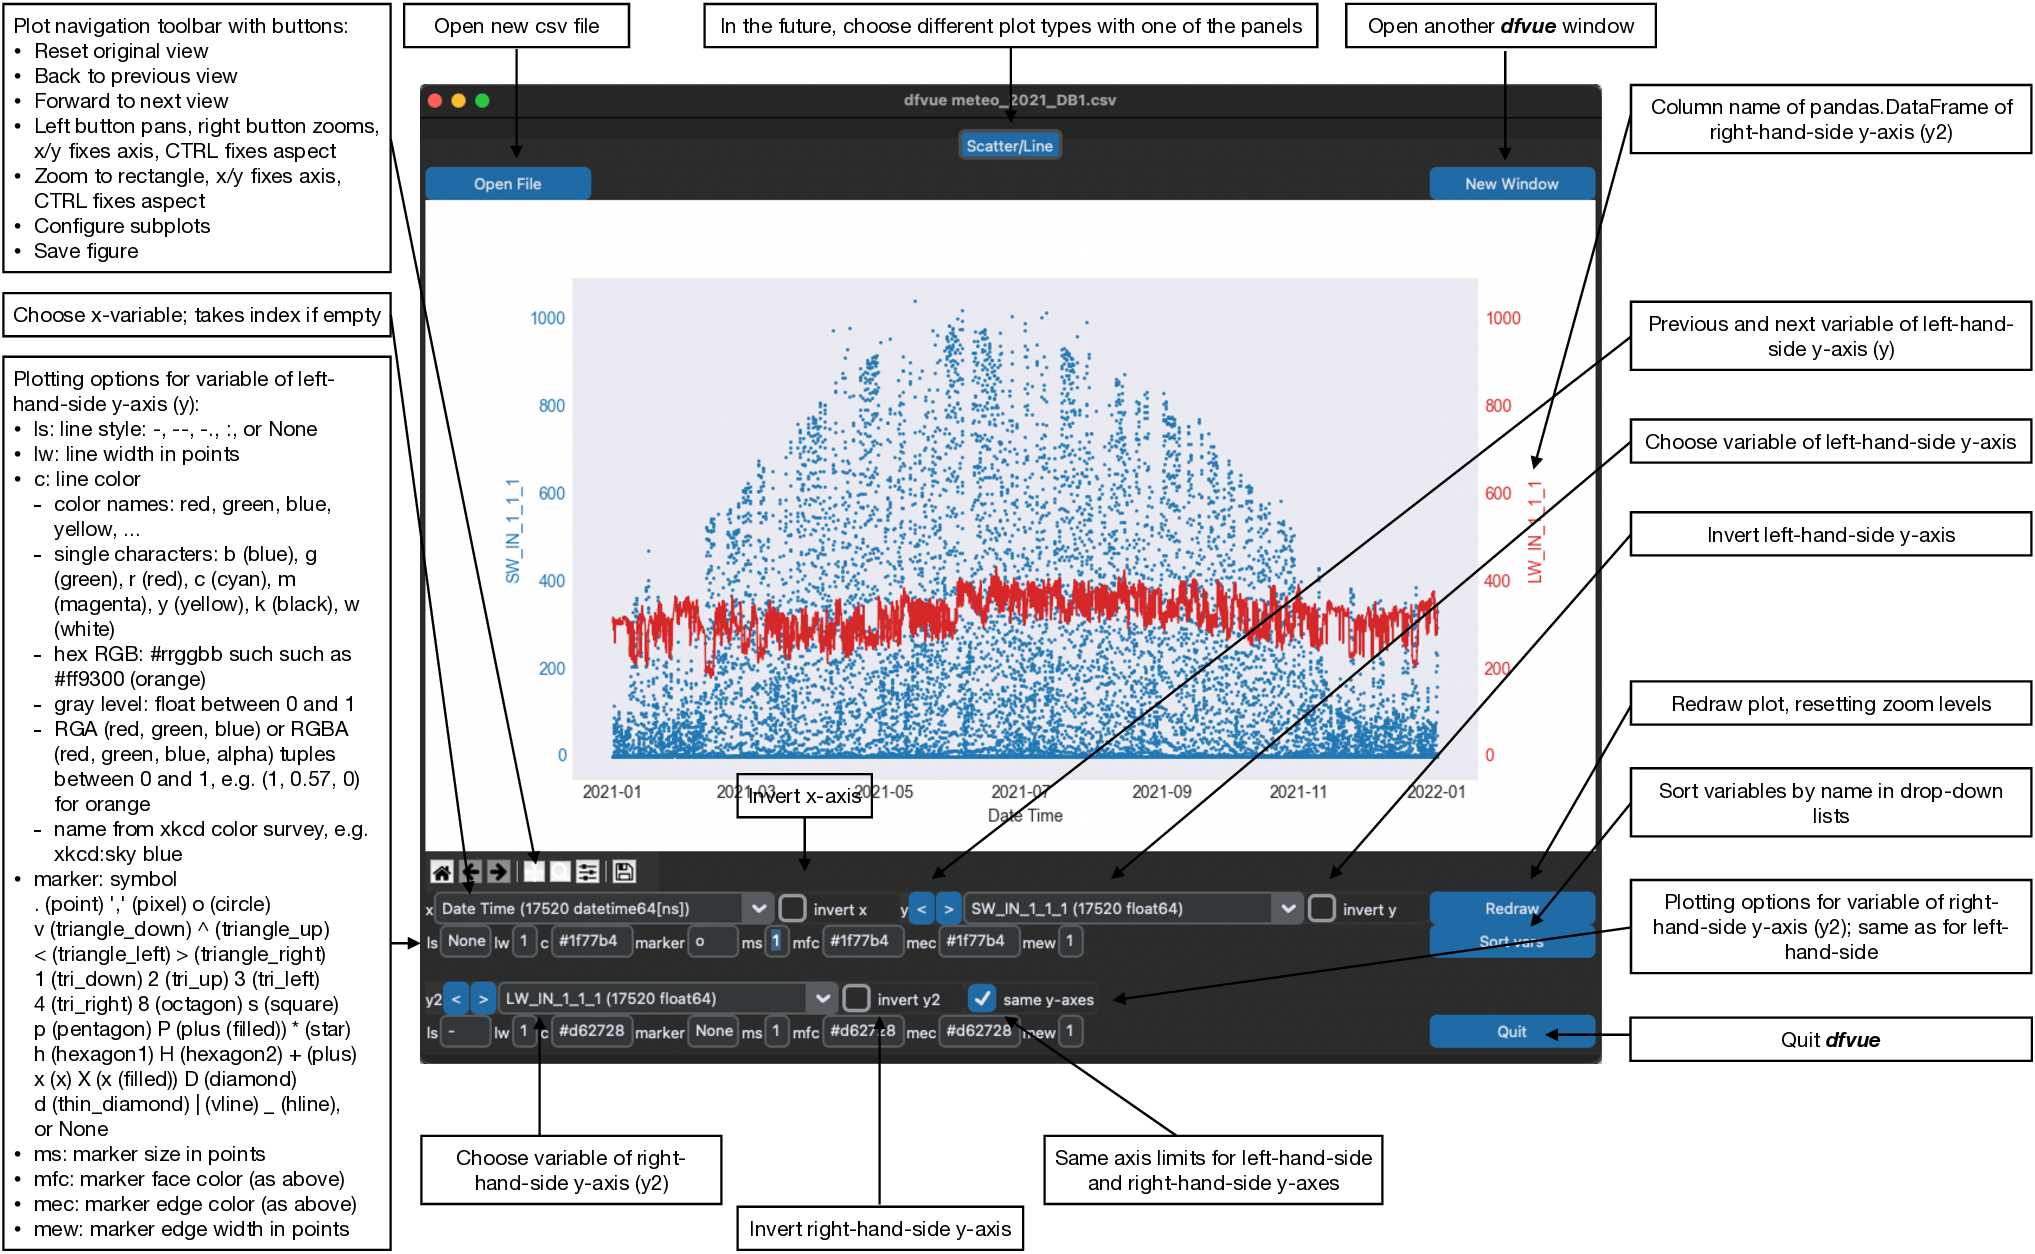
The default plot is a line plot with solid lines (line style ‘ls’ is ‘-‘). One can set line style ‘ls’ to None and set a marker symbol, e.g. ‘o’ for circles, to get a scatter plot. A large variety of line styles, marker symbols and color notations are supported.
Installation
dfvue is an application written in Python. If you have Python installed, then the best is to install dfvue within the Python universe. The easiest way to install dfvue is thence via pip:
python -m pip install dfvueor via Conda:
conda install -c conda-forge dfvueWe also provide a standalone macOS app and a Windows executable that come with everything needed to run dfvue including Python. The macOS app should work from macOS 10.13 (High Sierra) onward (tested on mac OS X 10.15, macOS 11, 12, and 13). Drop me a message if it does not work on newer operating systems.
See the installation instructions in the documentation for more information.
License
dfvue is distributed under the MIT License. See the LICENSE file for details.
Copyright (c) 2023- Matthias Cuntz
dfvue uses the Azure theme (v2.0) by rdbende on Linux and Windows.
Standalone applications are produced with cx_Freeze, currently maintained by Marcelo Duarte.


Download files
Download the file for your platform. If you're not sure which to choose, learn more about installing packages.


