Locally serve raster image tiles in the Slippy Map OGC standard.

Project description
Local Tile Server

This is a simple Flask application for serving raster image tiles locally in the OGC standard.
This uses large_image and GeoJS for the web viewer included with the application. You can use the web viewer to select and extract regions of interest from rasters.
This also provides an interface for viewing local rasters with ipyleaflet.
Installation
Install from PyPI: https://pypi.org/project/flask-tileserver/
pip install flask-tileserver
Note on installing GDAL
GDAL can be a pain to install, and you may want to handle GDAL before install flask-tileserver.
If on linux, I highly recommend using the large_image_wheels from Kitware.
pip install --find-links=https://girder.github.io/large_image_wheels GDAL
Otherwise, I recommend using conda:
conda install -c conda-forge GDAL
Usage
Local Web Application
Launch the tileserver from the commandline to use the included web application where you can view the raster and extract regions of interest.
python -m tileserver path/to/raster.tif

ipyleaflet Tile Layers
There are utilities included here for launching a tile server as a background thread to serve image tiles from any raster file on your
local file system. Further, I have inlcuded a utility for
automatically launching a tile server and creating an
ipyleaflet.TileLayer. Here is an example:
from tileserver import get_leaflet_tile_layer
from ipyleaflet import Map, projections, ScaleControl, FullScreenControl, SplitMapControl

m = Map(
        center=(37.7249511580583, -122.27230466902257),
        zoom=9, crs=projections.EPSG3857,
       )

# Create two tile layers from 2 seperate raster files
l = get_leaflet_tile_layer('~/Desktop/TC_NG_SFBay_US_Geo.tif',
                           band=1, palette='matplotlib.Viridis_20', vmin=50, vmax=200)
r = get_leaflet_tile_layer('~/Desktop/small.tif',
                           band=2, palette='matplotlib.Plasma_6', vmin=0, vmax=150)

control = SplitMapControl(left_layer=l, right_layer=r)
m.add_control(control)

m.add_control(ScaleControl(position='bottomleft'))
m.add_control(FullScreenControl())
m
Note: the color palette choices come form palettable
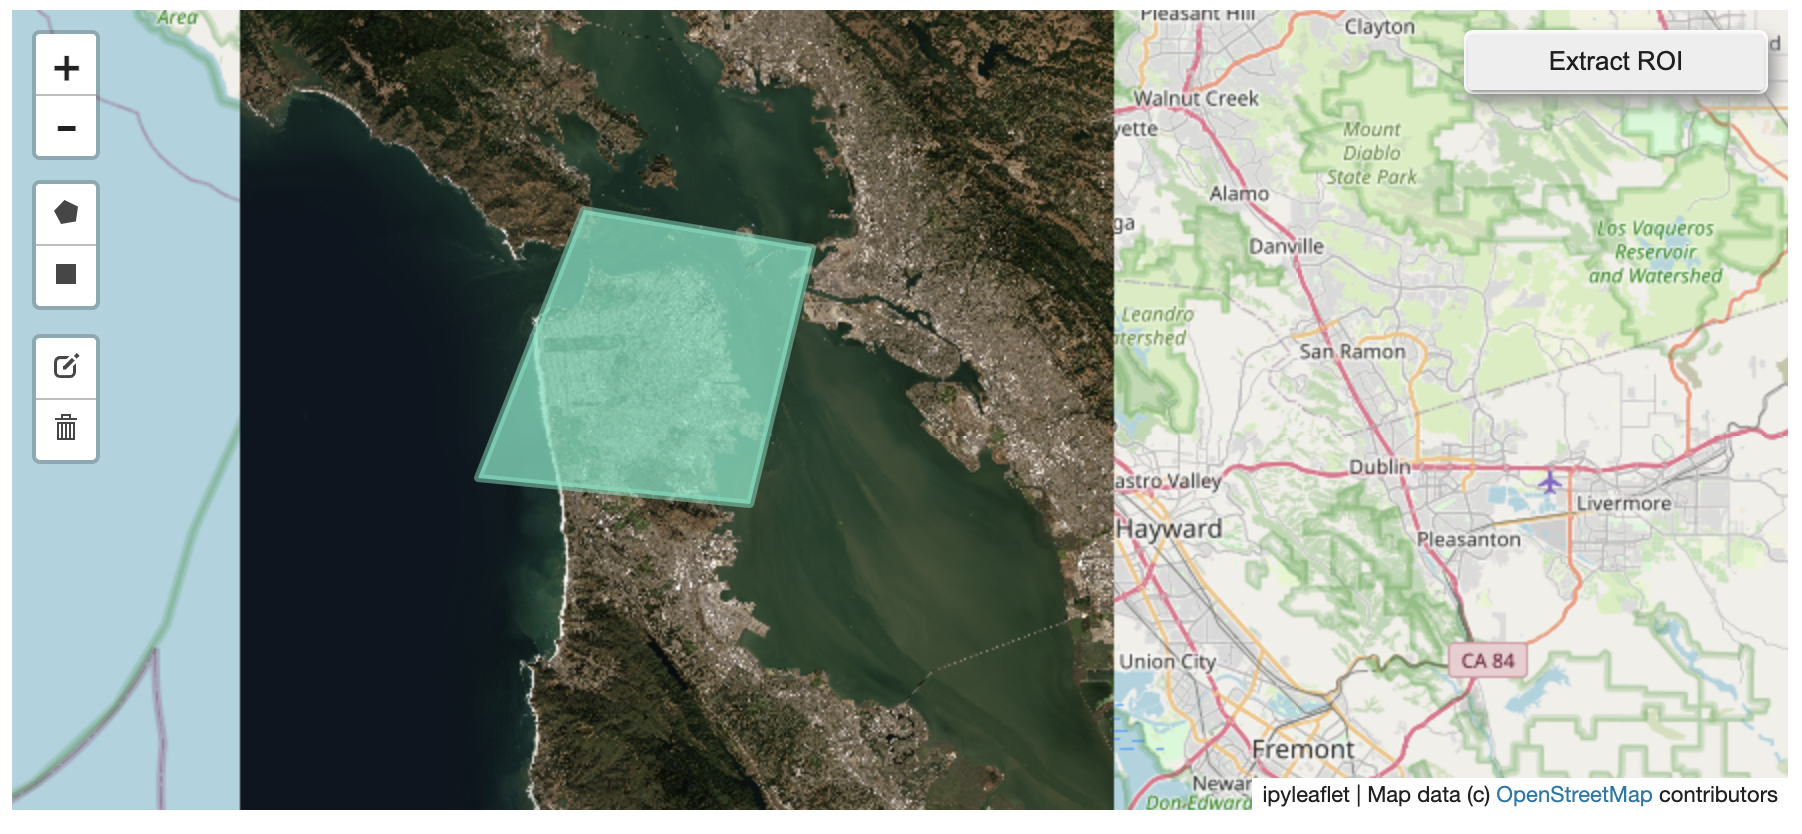
Using ipyleaflet for ROI Extraction
from tileserver import get_leaflet_tile_layer, get_leaflet_tile_layer_from_tile_server, TileServer
from ipyleaflet import Map, projections, ScaleControl, FullScreenControl, DrawControl

# First, create a tile server from local raster file
tile_server = TileServer('~/Desktop/TC_NG_SFBay_US_Geo.tif')

# Create ipyleaflet tile layer from that server
t = get_leaflet_tile_layer_from_tile_server(tile_server)

# Create ipyleaflet, add layers, add draw control, display
m = Map(
        center=(37.7249511580583, -122.27230466902257),
        zoom=9, crs=projections.EPSG3857,
       )
m.add_layer(t)
m.add_control(ScaleControl(position='bottomleft'))
m.add_control(FullScreenControl())
draw_control = DrawControl()
m.add_control(draw_control)
m
from shapely.geometry import Polygon

# Inspect `draw_control.data` to get the ROI
bbox = draw_control.data[0]
p = Polygon([tuple(l) for l in bbox['geometry']['coordinates'][0]])
left, bottom, right, top = p.bounds

roi_path = tile_server.extract_roi(left, right, bottom, top)
roi_path
r = get_leaflet_tile_layer(roi_path)

m2 = Map(
        center=(37.7249511580583, -122.27230466902257),
        zoom=9, crs=projections.EPSG3857,
       )
m2.add_layer(r)
m2.add_control(ScaleControl(position='bottomleft'))
m2.add_control(FullScreenControl())
m2

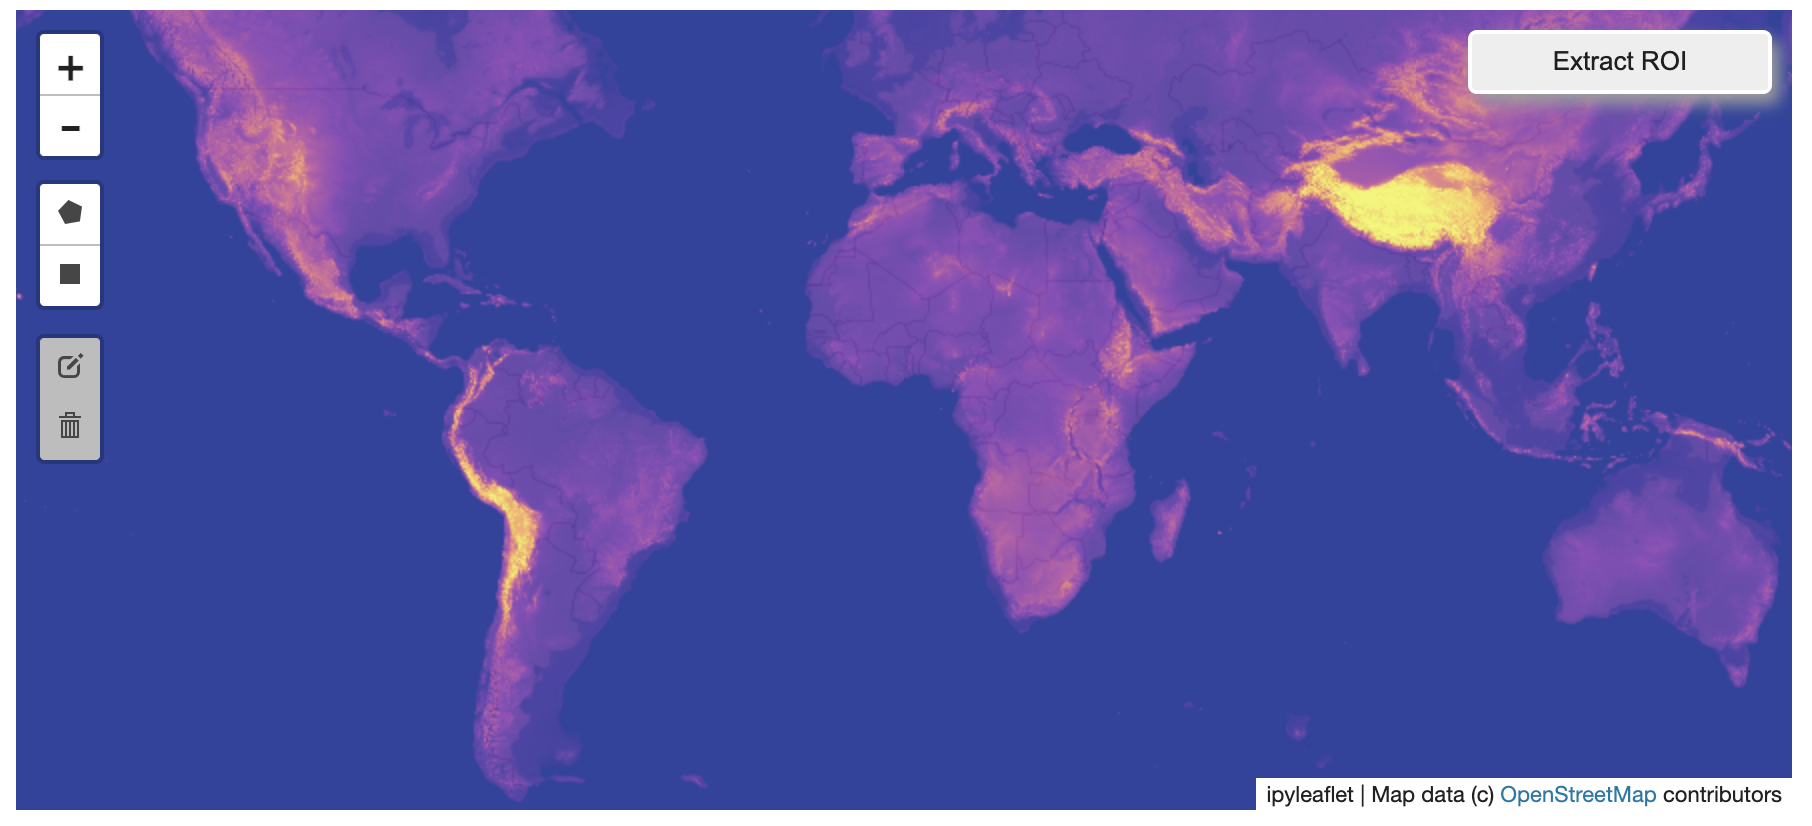
Example Datasets
A few example datasets are included with tileserver. A particulary
useful one has global elevation data which you can use to create high resolution Digital Elevation Models (DEMs) of a local region.
from tileserver import get_leaflet_tile_layer, get_leaflet_tile_layer_from_tile_server, examples
from ipyleaflet import Map, projections, DrawControl

# Load example tile layer from publically available DEM source
tile_server = examples.get_elevation()

# Create ipyleaflet tile layer from that server
t = get_leaflet_tile_layer_from_tile_server(tile_server,
                                            band=1, vmin=-500, vmax=5000,
                                            palette='mycarta.Cube1_19',
                                            opacity=0.75)

m = Map(
        zoom=2, crs=projections.EPSG3857,
       )
m.add_layer(t)
draw_control = DrawControl()
m.add_control(draw_control)
m
Then you can follow the same routine as described above to extract an ROI.
I zoomed in over Golden, Colorado and drew a polygon of the extent of the DEM I would like to create:
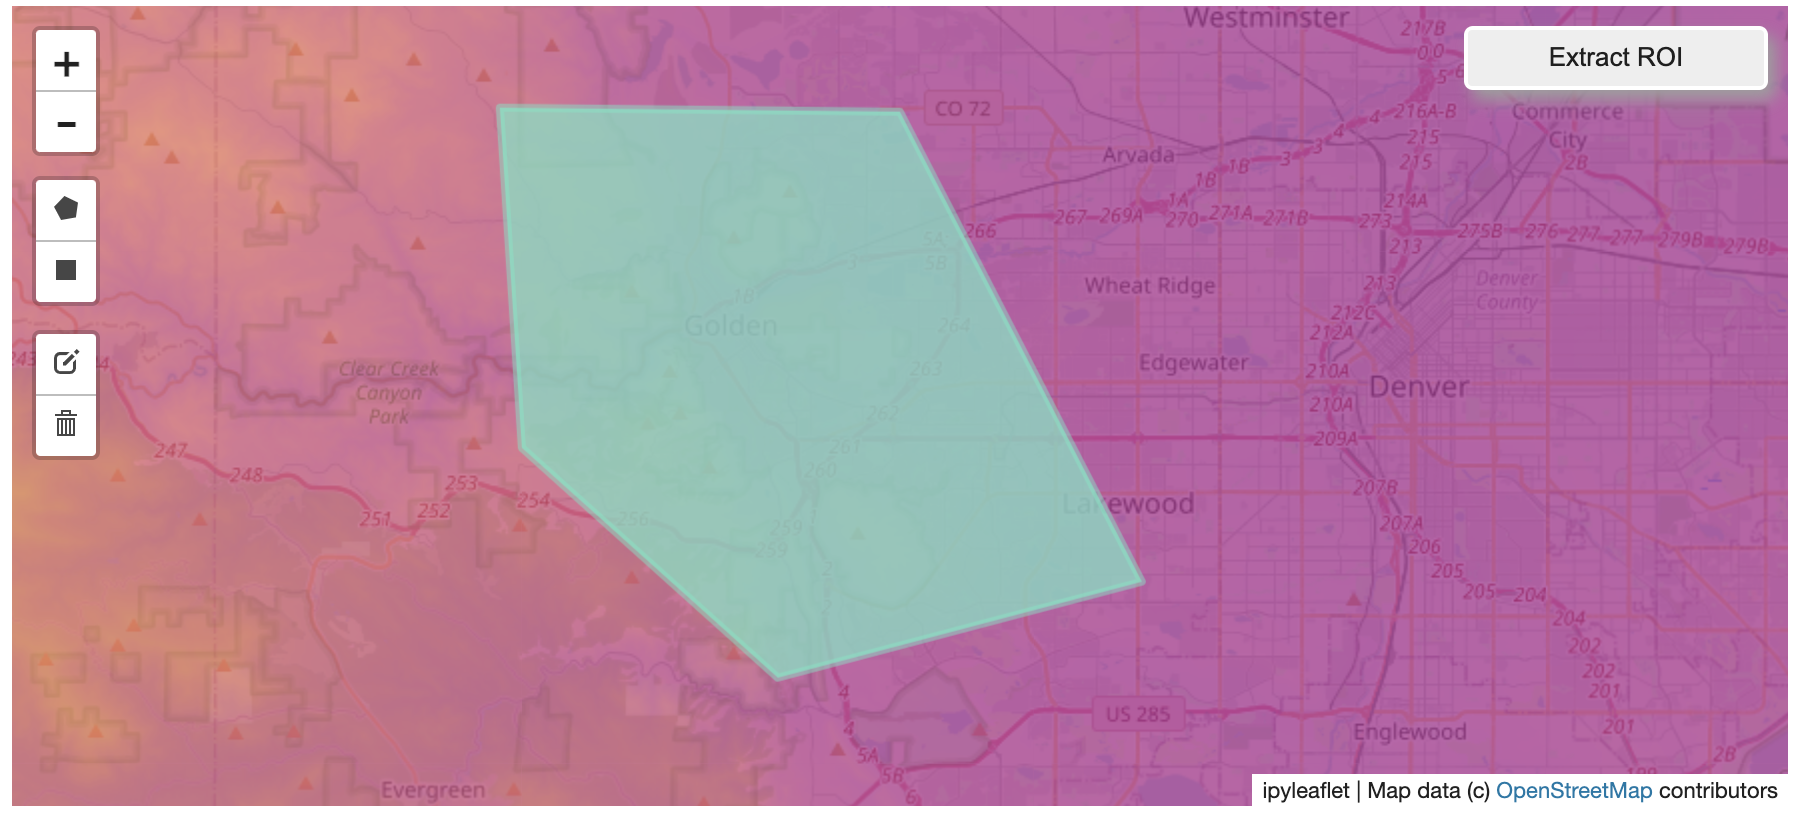
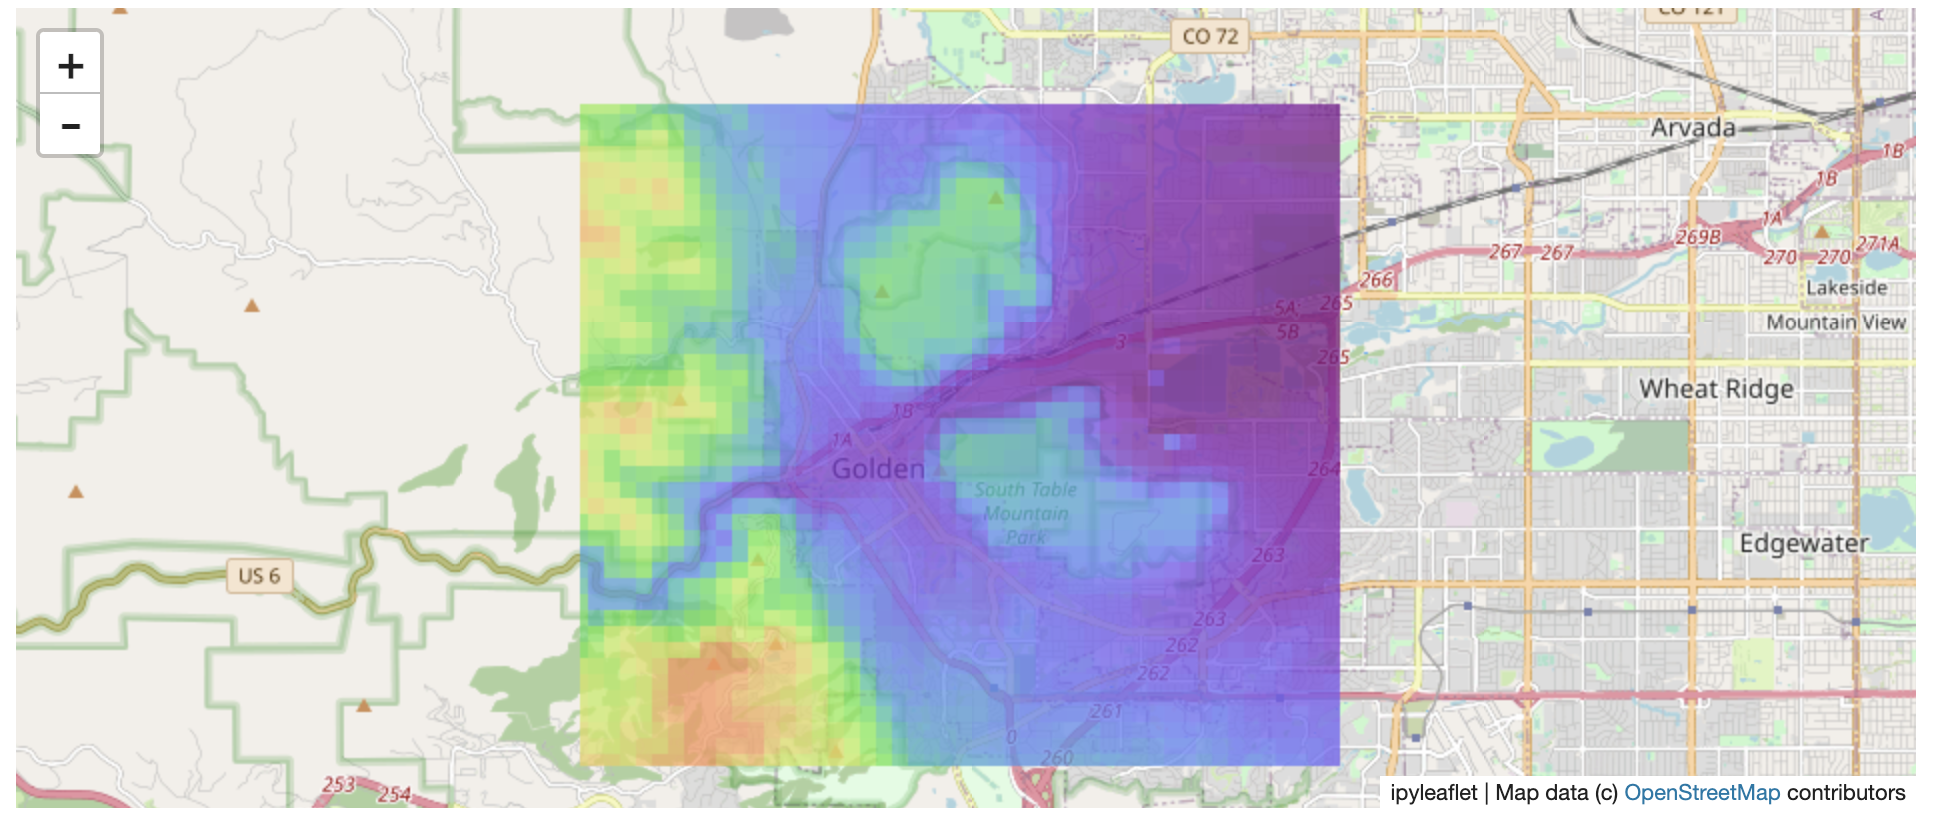
And perfrom the extraction:
from shapely.geometry import Polygon

# Inspect `draw_control.data` to get the ROI
bbox = draw_control.data[0]
p = Polygon([tuple(l) for l in bbox['geometry']['coordinates'][0]])
left, bottom, right, top = p.bounds

roi_path = tile_server.extract_roi(left, right, bottom, top)

r = get_leaflet_tile_layer(roi_path, band=1,
                           palette='mycarta.Cube1_19', opacity=0.75)

m2 = Map(
        center=(39.763427033262175, -105.20614908076823),
        zoom=12, crs=projections.EPSG3857,
       )
m2.add_layer(r)
m2
Release history Release notifications | RSS feed


Download files
Download the file for your platform. If you're not sure which to choose, learn more about installing packages.
Source Distributions
Built Distribution
Hashes for flask_tileserver-0.0.6-py3-none-any.whl
| Algorithm | Hash digest | |
|---|---|---|
| SHA256 | c93716adb850550cced3d1dfb0975d893c5bb602cc5f914e89acba24b56f81da |
|
| MD5 | f084a297d8c6847201a2494079c321be |
|
| BLAKE2b-256 | ce35d506be20fee24bef7fa2eed99de73f46f12266e19878f6982e1169b60238 |


