Gurobi log file tools for parsing and data exploration

Project description
GRBlogtools
Extract information from Gurobi log files and generate pandas DataFrames or Excel worksheets for further processing. Also includes a wrapper for out-of-the-box interactive visualizations using the plotting library Plotly.
Usage
First, you need a set of Gurobi log files to compare, e.g.,
- results from several model instances
- comparisons of different parameter settings
- performance variability experiments involving multiple random seed runs
- ...
Pandas/Plotly
-
parse log files:
import grblogtools as glt

summary, timelines, rootlp = glt.get_dataframe(["run1/*.log", "run2/*.log"], timelines=True)
Depending on your requirements, you may need to filter or modify the resulting DataFrames.
-
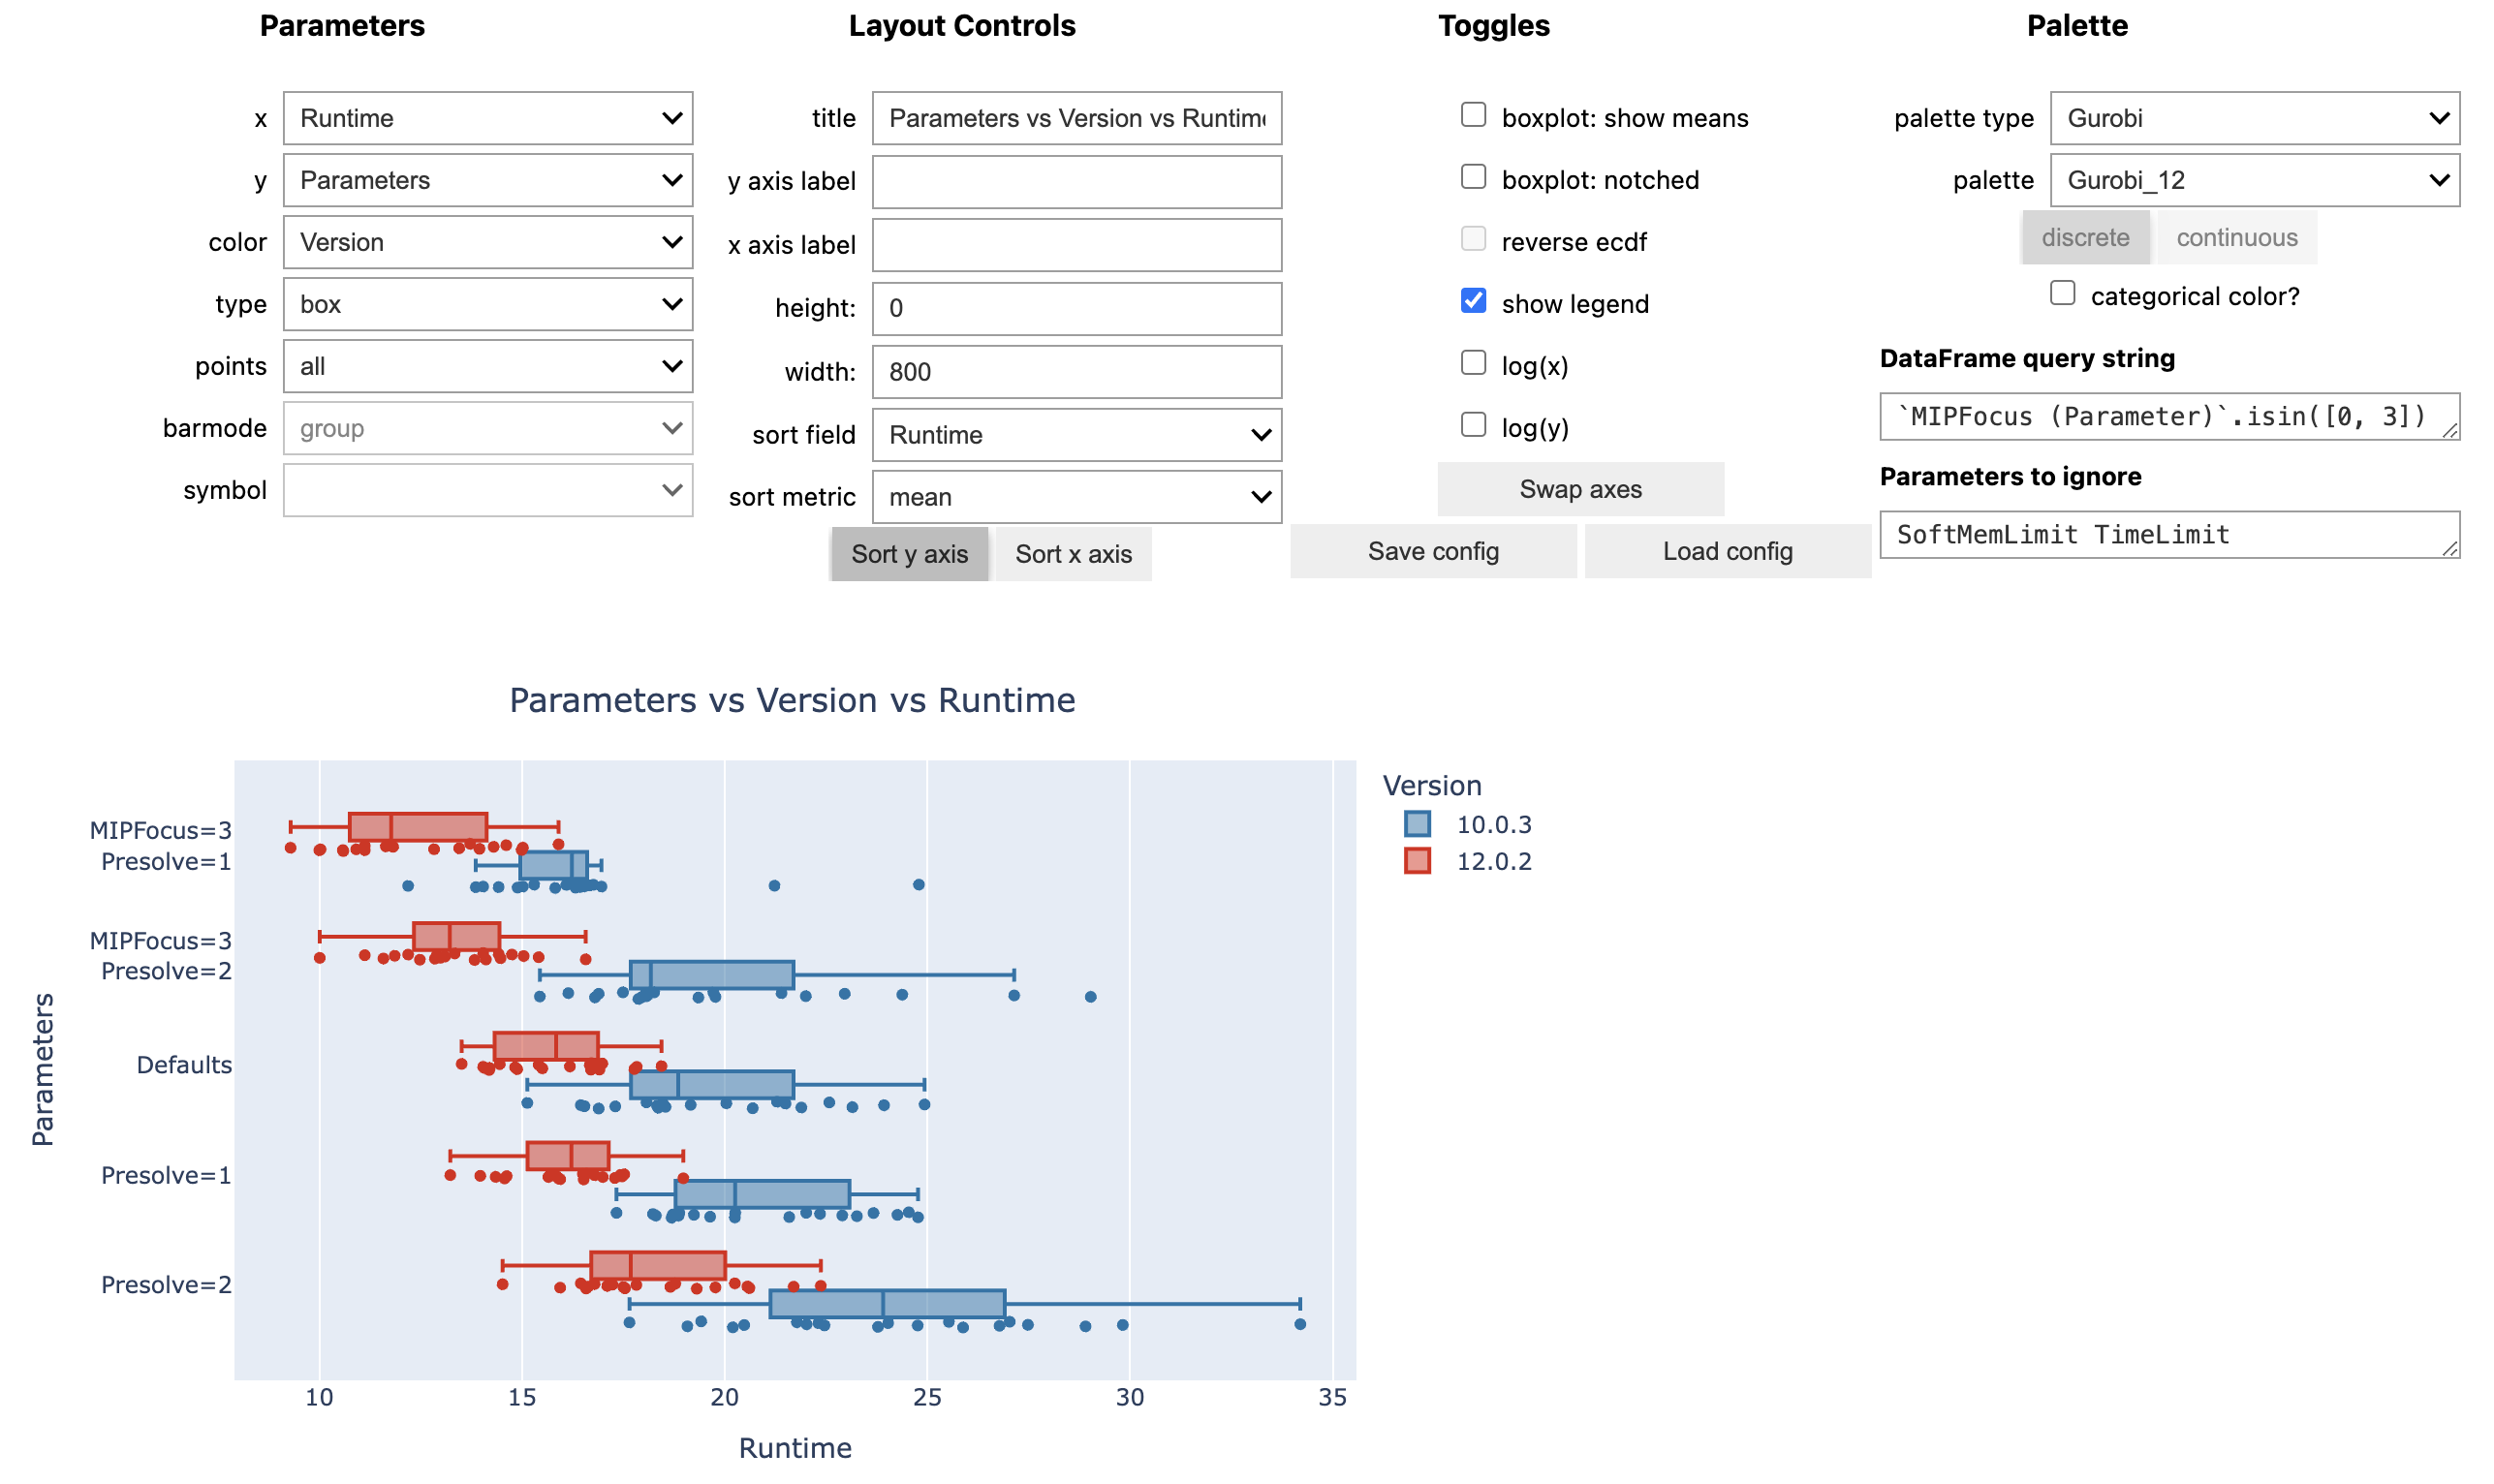
draw interactive charts, preferably in a Jupyter Notebook:
- final results from the individual runs:
glt.plot(summary, type="box")
- progress charts for the individual runs:
glt.plot(timelines, y="Gap", color="Log", type="line")
These are just examples using the Plotly Python library - of course, any other plotting library of your choice can be used to work with these DataFrames.
Excel
Convert your log files to Excel worksheets right on the command-line:
python -m grblogtools myrun.xlsx data/*.log
List all available options and how to use the command-line tool:
python -m grblogtools --help
Release history Release notifications | RSS feed


Download files
Download the file for your platform. If you're not sure which to choose, learn more about installing packages.
Source Distribution
Built Distribution
Hashes for grblogtools-0.3.1-py3-none-any.whl
| Algorithm | Hash digest | |
|---|---|---|
| SHA256 | f09938713420d6bc0a095126c4772ff781d5a1e39724b4b43cb7e0633a729f78 |
|
| MD5 | a07f57e99998ee14a61c9bc09ee095ca |
|
| BLAKE2b-256 | 0e219291eba268e82f2aed49e35344d3ba92c77dc28759c81788fdc5a8991c94 |


