A suite of convenience functions for exploring water data in a Jupyter Notebook.

Project description


a suite of convenience functions for exploring water data in Python.
Features
Retrieves stream data from the USGS NWIS service
Select data using multiple site numbers, by state, county codes, or a boundary box
Preserves NWIS metadata, including NoData values
Helpful error messages to help you write valid requests
Extracts data into a Pandas dataframe, json, or dict
- Plot beautiful graphs in Jupyter Notebooks
hydrographs (or time series of any data)
flow duration charts
cycle plots to illustrate annual or diurnal cycles
Interactive map for finding stream gauge ID numbers
Plotting and manipulation through Pandas dataframes
Retrieve USGS rating curves, peak discharges, field notes, and site files for gauging stations
Retrieve USGS daily, monthly, and annual statistics for gauging stations
Saves data in compact, easy-to-use parquet files instead of requesting the same dataset repeatedly
Massive Users Guide that makes Hydrology AND Data Science easy!
Still in active development! Let me know what features you want!
Read the Users Guide for more details.
Basic Usage
First, import hydrofunctions into your project and enable automatic chart display:
>>> import hydrofunctions as hf
>>> %matplotlib inline
Create NWIS data object to hold our request and the data we will retrieve. We will request the daily values (‘dv’) for site ‘0158520’ for the past 55 days:
>>> herring = hf.NWIS('01585200', 'dv', period='P55D')
Requested data from https://waterservices.usgs.gov/nwis/iv/?format=json%2C1.1&sites=01585200&period=P55D
Find out what data we received:
>>> herring
USGS:01585200: WEST BRANCH HERRING RUN AT IDLEWYLDE, MD
    00060: <5 * Minutes>  Discharge, cubic feet per second
    00065: <5 * Minutes>  Gage height, feet
Start: 2019-05-25 01:05:00+00:00
End:   2019-07-19 19:05:00+00:00
This tells us the name of our site, and gives a list of the parameters that we have. For each parameter it lists how frequently the data were collected, and it show the common name of the parameter and its units.
Create a dataframe from our data, and list the first five items:
>>> herring.df().head()–a table with our data appears–
datetimeUTC
USGS:01585200:00060:00000
2019-05-25 01:05:00+00:00
1.57
2019-05-25 01:10:00+00:00
1.57
2019-05-25 01:15:00+00:00
1.51
2019-05-25 01:20:00+00:00
1.57
2019-05-25 01:25:00+00:00
1.57
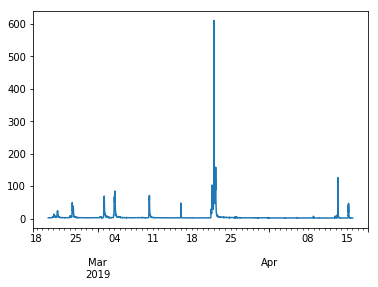
Plot the data using built-in methods from Pandas and mathplotlib:
>>> herring.df().plot()–a stream hydrograph appears–
Easy Installation
The easiest way to install Hydrofunctions is by typing this from your command line:
$ pip install hydrofunctionsHydrofunctions depends upon Pandas and numerous other scientific packages for Python. Anaconda is an easy, safe, open-source method for downloading everything and avoiding conflicts with other versions of Python that might be running on your computer.
Release history Release notifications | RSS feed


Download files
Download the file for your platform. If you're not sure which to choose, learn more about installing packages.
Source Distribution
Built Distribution
Hashes for hydrofunctions-0.2.1-py3-none-any.whl
| Algorithm | Hash digest | |
|---|---|---|
| SHA256 | 01cb88a959511d815f5babc559267bea3af067de5e10a187734f367d709e2812 |
|
| MD5 | cb7a7346d85592df05cddf87dbeecc04 |
|
| BLAKE2b-256 | a6a02b9c99914ab88dc60d9cc1d62f52d95ea471c4abfca3a6ff89accf0423cb |


