InGenAnnot: Inspection of Gene Annotation

Project description


InGenAnnot: Inspection of Gene Annotation
InGenAnnot is a set of utilities to inspect and generate
statistics for one or several sets of gene annotations. It allows
structure comparison and can help you to prioritize your
efforts in manual curation. InGenAnnot uses among other
things, the Sequence Ontology gene-splicing classification SO [1] that aims to classify alternative transcripts in seven
categories or the Annotation Edit Distance AED [2] proposed as a metric for
evidence support.
As several approaches and tools exist to annotate genes in newly assembled genomes, it could be usefull to compare predictions and extract best evidence supported.
InGenAnnot can handle multiple gffs from different sources. In case of several annotations, gene boundaries are often divergent
(especially if you tried to predict UTR regions), that implies to
clusterize genes, to propose new loci sharing a list of transcripts.
We define these new loci as 'meta-gene' and propose several options
to clusterize them. We tried to summarize the pro and cons of classification feature type in the following table.
| pros | cons | |
|---|---|---|
--clu-type gene |
detect problem of missens predictions | overlaps of UTR merge different genes, not suitable for compact genomes |
--clu-type cds |
detect problem of missens predictions | could not correct split CDS |
--clu-type gene --clu-stranded |
resolve conflict between genes and possible non-coding RNA on the opposite strand | will not detect severe problem due to divergent prediction on opposite strand, overlaps of UTR merge different genes |
--clu-type cds --clu-stranded |
resolve conflict between genes and possible non-coding RNA on the opposite strand | will not detect severe problem due to divergent prediction on opposite strand |
In most cases, we recommended to use --clu-type cds with --clu-stranded to avoid gene merge. A post-process is implemented to remove overlapping CDS, keeping gene models with the best AED scores.
Selection of best gene structures, evidence-driven with Annotation Edit Distance (AED)
Annotation Edit Distance AED [2] was proposed as metric for gene annotation prediction and was implemented in MAKER [3] to filter out predicted models based on their AED. Here we propose some options which modify the computation of this distance and take into account the different sources of evidence. All gene prediction tools are not able to predict UTRs, despite the RNA-Seq data and Long-read based transcripts. So to avoid penalizing gene modelis limited to CDS, we implemented an overflow penalty parameter to maximize the score of model fitting best with transcript evidence despite missing UTRs. In addition, we compute separately the AED with transcript and proteomic evidence. Some genes are only supported with a transcript evidence (new/specifcic genes), a protein evidence (gene not expressed in our data), or in both type of evidences. Then to select the best model, we classified genes according to their AED for tr and pr separately. In case where the first gene is the same in the both ranking, we select this last one. If not, we compute the two distances between models according to their ranking, and select the most divergent.
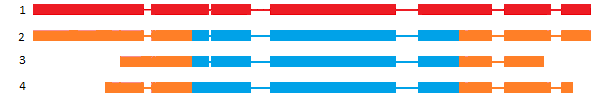
How to use the different parameters and their impact on the computed AED ratio ? Below we simulated different cases with different parameters and shown the impact on the computed AED:
AED with proteins:
Only the CDS part of the gene model is used. So UTRs were discarded.
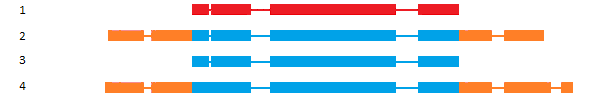
AED with transcripts assembled from RNA-Seq data:
Only the CDS part of the gene model is used, to avoid bias in comparison between gene models with or without UTRs depending of the gene predictor. Moreover, UTRs inferred from RNA-Seq transcripts are possibly wrong due to the data (weak/high coverage) and the assembly software. So here the AED is the distance between the CDS of the gene model and the transcript evidence. If you absolutely want to exclude/penalize gene models non-fitting the splicing sites of the transcript on their CDS parts, you can use an option to add a penalty weigth --penalty_overflow, set to 0.0 (no penalty) by default.
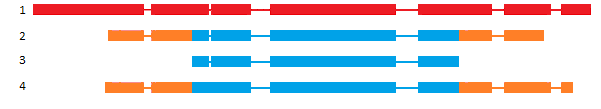
AED with transcripts recovered with Long-reads (Iso-Seq, Nanopore):
All the gene model is used (exons with CDS/UTRs). Long-reads transcript evidences are considered as very reliable evidences on their CDS and UTRs parts. So we expect a very good fit with the gene model and the evidence. For this reason, in case of divergence in splicing sites, a penalty weight parameter is applied, --longreads_penalty_overflow, set to 0.25 by default. This penalty is only applied if a difference of splicing sites was observed in the CDS parts of the gene model. We allow divergences in UTRs, that could be corrected later with the utr_refine command.
For more options and fully described use case, see the documentation select tool or select use case
Classification based on Sequence Ontology (SO)
SO [1] classification is interesting in case of annotation comparison, higligthing discrepencies between gene models at the same locus. But it could be used to compare gene structure or isoform structure of the same annotation dataset to control the quality of the predicted isoforms.
| Class | definition | example |
|---|---|---|
| N:0:0 | No transcript-pairs share any exon sequence |  |
| N:N:0 | Some transcript-pairs share sequence, but none have common exon boundaries |  |
| N:0:N | Some transcript-pairs share no sequence, others have common exon boundaries |  |
| N:N:N | Some transcript-pairs share no sequence, others have common sequence and exon boundaries | 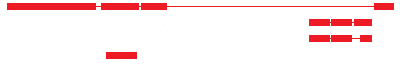 |
| 0:N:0 | All transcript-pairs share sequence in common, but none share exon boundaries | 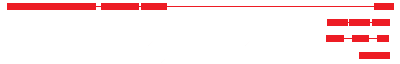 |
| 0:N:N | All transcript-pairs share sequence in common and some share exon boundaries | 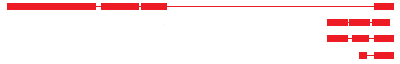 |
| 0:0:N | All transcript-pairs share some exons in common | 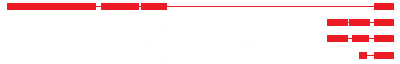 |
As described above, the SO classification was originally based on exon boundaries, that could be highly problematic for de-novo annotations with poorly defined UTR parts. To avoid such problem, you can choose to perform the same classification based on CDS coordinates. In this case you will obtained less biased results (See table above for pros/cons of clustering).
Documentation: install, tools and use cases
InGenAnnot comes with multiple tools allowing analysis of your gene prediction datasets. You will be able to compare, select and annotate your genes with different tools (link to documentation). Full use cases are described step by step, such as:
References
- [1] Eilbeck, K., Lewis, S. E., Mungall, C. J., Yandell, M., Stein, L., Durbin, R., and Ashburner, M. 2005. Open Access The Sequence Ontology: a tool for the unification of genome annotations. Genome Biol. 6:R44
- [2] Eilbeck K, Moore B, Holt C, Yandell M. Quantitative measures for the management and comparison of annotated genomes. BMC Bioinformatics. 2009 Feb 23;10:67. doi: 10.1186/1471-2105-10-67. PMID: 19236712; PMCID: PMC2653490.
- [3] Cantarel BL, Korf I, Robb SM, et al. MAKER: an easy-to-use annotation pipeline designed for emerging model organism genomes. Genome Res. 2008;18(1):188-196. doi:10.1101/gr.6743907
Release history Release notifications | RSS feed


Download files
Download the file for your platform. If you're not sure which to choose, learn more about installing packages.
Source Distribution
Built Distribution
Hashes for ingenannot-0.0.11-py3-none-any.whl
| Algorithm | Hash digest | |
|---|---|---|
| SHA256 | 304797127fbd7f76b25accabe480b0dd260627d4629e41f2a9afe2104c5055e6 |
|
| MD5 | 9008ca595f01182f0ae0015f9ee18782 |
|
| BLAKE2b-256 | c199b94e4f706312eb34b9288b56db76fab9ff613bfeba792a90f38866060b22 |


