Process live and historical data from luftdaten.info. Filter by station-id, sensor-id and sensor-type, apply reverse geocoding, store into timeseries and RDBMS databases, publish to MQTT or just output as JSON.

Project description


Luftdatenpumpe
Process live and historical data from luftdaten.info. Filter by station-id, sensor-id and sensor-type, apply reverse geocoding, store into timeseries and RDBMS databases (InfluxDB and PostGIS), publish to MQTT or just output as JSON.
For running advanced GIS queries against the created PostGIS database, please follow up at the GIS documentation.

About
Luftdatenpumpe acquires the measurement readings either from the livedata API of luftdaten.info or from its archived CSV files published to archive.luftdaten.info. To minimize impact on the upstream servers, all data gets reasonably cached.
While iterating the readings, it optionally filters on station-id, sensor-id or sensor-type and restrains information processing to the corresponding stations and sensors.
Then, each station’s location information gets enhanced by
attaching its geospatial position as a Geohash.
attaching a synthetic real-world address resolved using the reverse geocoding service Nominatim by OpenStreetMap.
Information about stations can be
displayed on STDOUT or STDERR in JSON format.
filtered and transformed interactively through jq, the swiss army knife of JSON manipulation.
stored into RDBMS databases like PostgreSQL using the fine dataset package. Being built on top of SQLAlchemy, this supports all major databases.
Measurement readings can be
Screenshots
Display luftdaten.info (LDI) measurements on Grafana Worldmap Panel.
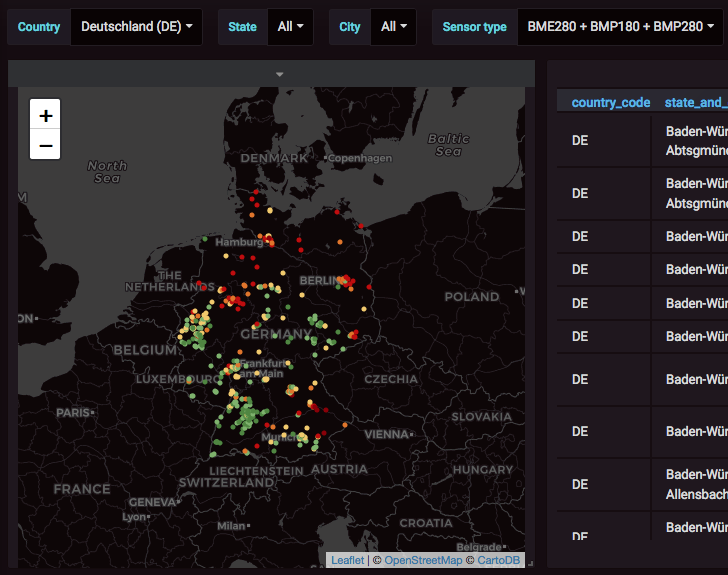
Worldmap and address
Map and station info display. Filter by different synthesized address components and sensor type.
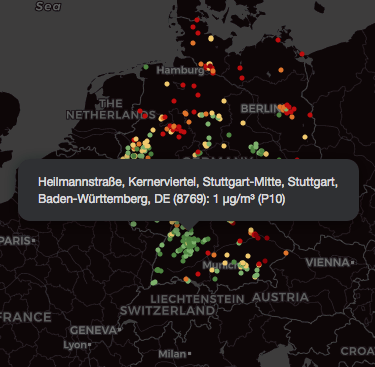
Map overlay
Display verbose name from OSM address and station id on overlay.
Live data
Canonical dashboards
Labs
Synopsis
Overview
# List stations
luftdatenpumpe stations --station=28,297 --reverse-geocode

# Write list of stations and metadata to PostgreSQL database
luftdatenpumpe stations --station=28,1071 --reverse-geocode --target=postgresql:///weatherbase

# Forward readings to MQTT
luftdatenpumpe readings --station=28,1071 --target=mqtt://mqtt.example.org/luftdaten.info
For a full overview about all program options including meaningful examples, you might just want to run luftdatenpumpe --help on your command line or visit luftdatenpumpe –help.
Details
Usage:
  luftdatenpumpe stations [options] [--target=<target>]...
  luftdatenpumpe readings [options] [--target=<target>]...
  luftdatenpumpe grafana --kind=<kind> --name=<name> [--variables=<variables>]
  luftdatenpumpe --version
  luftdatenpumpe (-h | --help)

Options:
  --source=<source>             Data source, either "api" or "file://" [default: api].
  --station=<stations>          Filter data by given location ids, comma-separated.
  --sensor=<sensors>            Filter data by given sensor ids, comma-separated.
  --sensor-type=<sensor-types>  Filter data by given sensor types, comma-separated.
  --reverse-geocode             Compute geographical address using the Nominatim reverse geocoder
  --target=<target>             Data output target
  --create-database-view        Create database view like "ldi_view" spanning all tables.
  --disable-nominatim-cache     Disable Nominatim reverse geocoder cache
  --progress                    Show progress bar
  --version                     Show version information
  --dry-run                     Skip publishing to MQTT bus
  --debug                       Enable debug messages
  -h --help                     Show this screen
Setup
Configure package repository
Hiveeyes is hosting recent releases of InfluxDB and Grafana there. We are mostly also running exactly these releases on our production servers.
Add Hiveeyes package repository:
wget -qO - https://packages.hiveeyes.org/hiveeyes/foss/debian/pubkey.txt | apt-key add -
Add Hiveeyes package repository, e.g. by appending this to /etc/apt/sources.list:
deb https://packages.hiveeyes.org/hiveeyes/foss/debian/ testing main foundation
Reindex package database:
apt install apt-transport-https
apt update
Install packages
Debian packages:
apt install postgis redis-server redis-tools influxdb grafana
Configure PostgreSQL
Create user and database:
su - postgres
createuser --no-createdb --pwprompt hiveeyes
createdb --owner hiveeyes weatherbase
Create read-only user:
psql

postgres=# \c weatherbase
weatherbase=# CREATE ROLE readonly WITH LOGIN PASSWORD 'readonly';
weatherbase=# GRANT USAGE, SELECT ON ALL SEQUENCES IN SCHEMA public TO readonly;
weatherbase=# GRANT SELECT ON ALL TABLES IN SCHEMA public TO readonly;
Configure Redis
This program extensively uses a runtime cache based on Redis. To make this work best, you should enable data durability with your Redis instance.
The append-only file is an alternative, fully-durable strategy for Redis. It became available in version 1.1. You can turn on the AOF in your Redis configuration file (e.g. /etc/redis/redis.conf):
appendonly yes
Install Luftdatenpumpe
apt install build-essential python3-dev libicu-dev
pip install luftdatenpumpe
Running
At this point, you should try to conduct simple tests like outlined in the synopsis section above.
After that, you might want to advance into reading about integrating Luftdatenpumpe with Grafana in order to learn about how to build such beautiful and interactive map- and graph-compositions.
References
luftdaten.info
Resources
Technologies
Standing on the shoulders of giants.
Databases
Software and services
License
This program is free software; you can redistribute it and/or modify it under the terms of the GNU Affero General Public License as published by the Free Software Foundation; either version 3 of the License, or (at your option) any later version.
This program is distributed in the hope that it will be useful, but WITHOUT ANY WARRANTY; without even the implied warranty of MERCHANTABILITY or FITNESS FOR A PARTICULAR PURPOSE. See the GNU General Public License for more details.
You should have received a copy of the GNU Affero General Public License along with this program; if not, see: <http://www.gnu.org/licenses/agpl-3.0.txt>, or write to the Free Software Foundation, Inc., 51 Franklin Street, Fifth Floor, Boston, MA 02110-1301 USA
Content attributions
The copyright of particular images and pictograms are held by their respective owners, unless otherwise noted.
Icons and pictograms
Water Pump Free Icon from Icon Fonts is licensed by CC BY 3.0.
Release history Release notifications | RSS feed


Download files
Download the file for your platform. If you're not sure which to choose, learn more about installing packages.


