Microbial Genome Circular plotting tool using Circos

Project description
MGCplotter: Microbial Genome Circular plotter


Table of Contents
Overview
MGCplotter is easy-to-use command line tool for plotting microbial genome in circular layout using Circos. MGCplotter requires Genbank format genome file and implements following 3 main functions for plotting figure.
-
Plot Basic Features of Microbial Genome
Basic Features mean Forward/Reverse CDS, rRNA, tRNA, GC content, GC skew.
MGCplotter can control plot result of feature's color/size/visibility by command options. -
Assign & Plot COG Functional Classification
Assign COG functional classification to reference genome CDS using COGclassifier. COG functional classification colors are used in plot result of forward/reverse CDS.List of COG Functional Classification Color
-
Search & Plot Conserved CDS between reference and query species
Conserved CDS of query genome relative to reference genome is searched by MMseqs2 RBH method. Each query conserved CDS is plotted with gradient color based on identity of RBH result.
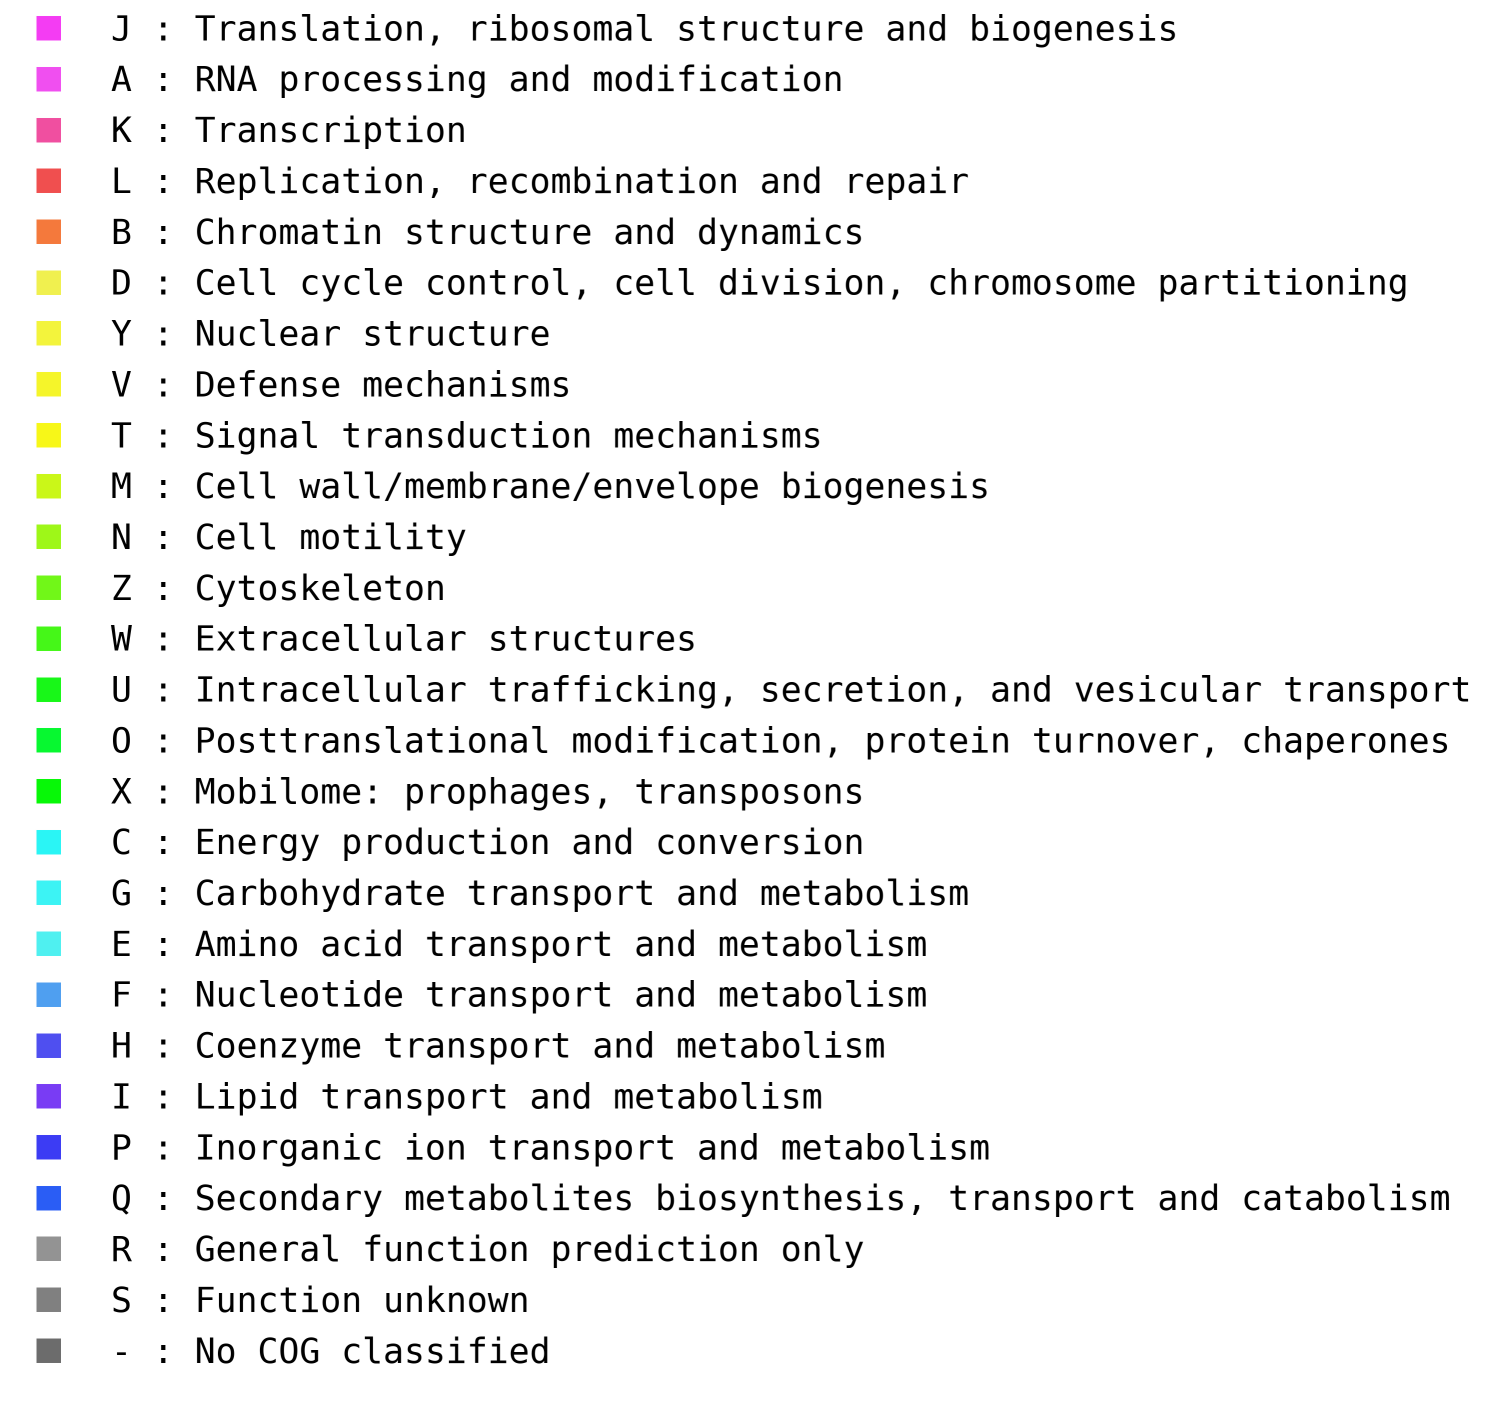
Fig.1: Plot result of Mycoplasma Gallisepticum genome
Outer to inner tracks mean (1) Forward CDS (2) Reverse CDS (3) rRNA (4) tRNA (5) GC content (6) GC skew, respectively.
COG functional classification color is assigned to Forward/Reverse CDS.
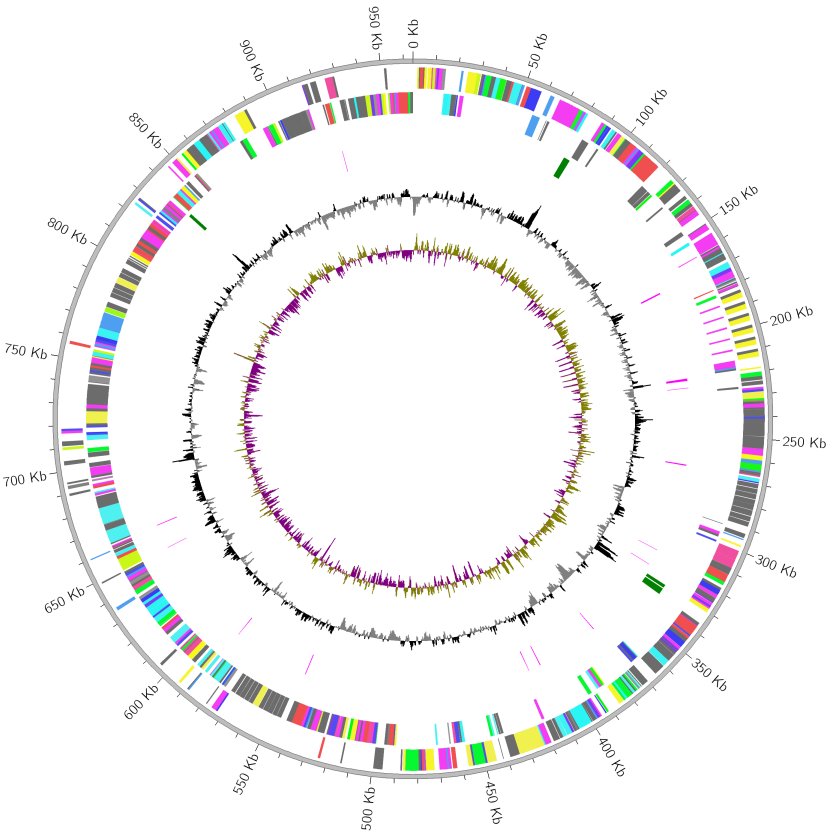
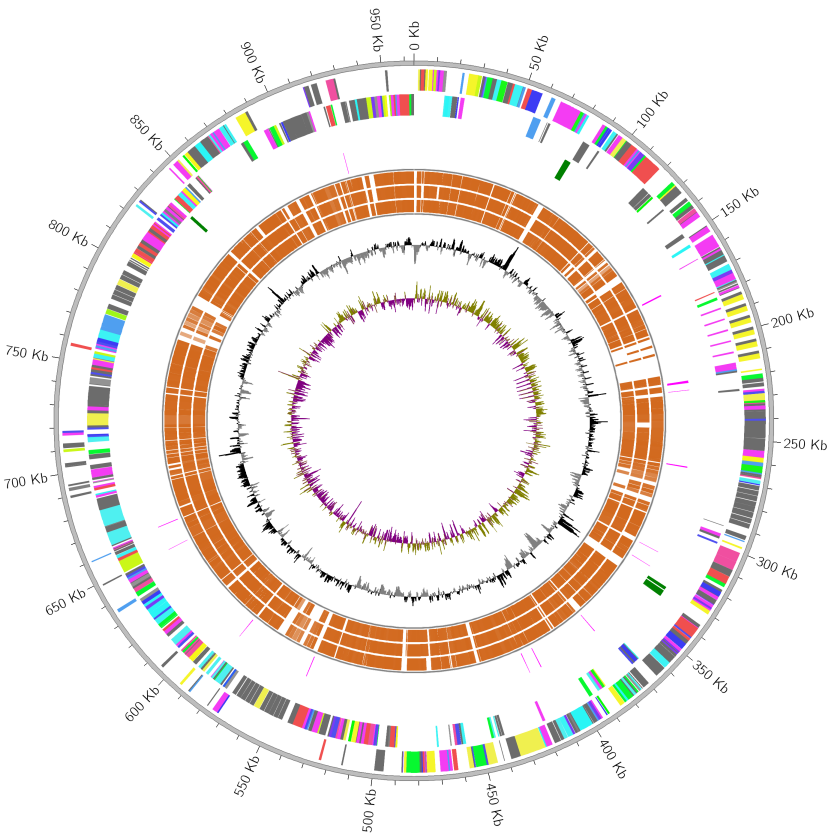
Fig.2: Add conserved CDS tracks of 3 query species to Fig.1
Conserved CDS of query genomes relative to reference genome is shown.
Installation
MGCplotter is implemented in Python3.
Install bioconda package:
conda install -c conda-forge -c bioconda mgcplotter
Install PyPI pakcage:
pip install mgcplotter
Use Docker (Docker Image):
docker pull moshi4/mgcplotter:latest
docker run moshi4/mgcplotter:latest MGCplotter -h
Dependencies
- Circos
Software package for visualizing data and information in circular layout - COGclassifier
A tool for classifying prokaryote protein sequences into COG functional category - MMseqs2
Ultra fast and sensitive sequence search and clustering suite
Usage
Basic Command
MGCplotter -r [genome genbank file] -o [output directory] --assign_cog_color
Options
General Options:
  -r R, --ref_file R      Reference genome genbank file (*.gb|*.gbk|*.gbff)
  -o O, --outdir O        Output directory
  --query_files  [ ...]   Query CDS fasta or genome genbank files (*.fa|*.faa|*.fasta|*.gb|*.gbk|*.gbff)
  --cog_evalue            COGclassifier e-value parameter (Default: 1e-02)
  --mmseqs_evalue         MMseqs RBH search e-value parameter (Default: 1e-03)
  -t , --thread_num       Threads number parameter (Default: MaxThread - 1)
  -f, --force             Forcibly overwrite previous calculation result (Default: OFF)
  -v, --version           Print version information
  -h, --help              Show this help message and exit

Graph Size Options:
  --ticks_labelsize       Ticks label size (Default: 35)
  --forward_cds_r         Forward CDS track radius size (Default: 0.07)
  --reverse_cds_r         Reverse CDS track radius size (Default: 0.07)
  --rrna_r                rRNA track radius size (Default: 0.07)
  --trna_r                tRNA track radius size (Default: 0.07)
  --conserved_cds_r       Conserved CDS track radius size (Default: 0.04)
  --gc_content_r          GC content track radius size (Default: 0.15)
  --gc_skew_r             GC skew track radius size (Default: 0.15)

Graph Color Options:
  --assign_cog_color      Assign COG classification color to reference CDSs (Default: OFF)
  --cog_color_json        User-defined COG classification color json file
  --forward_cds_color     Forward CDS color (Default: 'red')
  --reverse_cds_color     Reverse CDS color (Default: 'blue')
  --rrna_color            rRNA color (Default: 'green')
  --trna_color            tRNA color (Default: 'magenta')
  --conserved_cds_color   Conserved CDS color (Default: 'chocolate')
  --gc_content_p_color    GC content color for positive value from average (Default: 'black')
  --gc_content_n_color    GC content color for negative value from average (Default: 'grey')
  --gc_skew_p_color       GC skew color for positive value (Default: 'olive')
  --gc_skew_n_color       GC skew color for negative value (Default: 'purple')
Example Command
1. M.Gallisepticum genome simple plot (= Fig.1)
Reference: Mgallisepticum.gbff (0.63 MB)
MGCplotter -r Mgallisepticum.gbff -o ./example_result01 --assign_cog_color
2. M.Gallisepticum genome plot with 3 query conserved CDS (= Fig.2)
Reference: Mgallisepticum.gbff (0.63 MB), Query: example02 (2.0 MB)
MGCplotter -r Mgallisepticum.gbff -o ./example_result02 --assign_cog_color \
           --query_files ./example02/*.gbff
Output Contents
-
circos[.png|.svg]
Plot result figure file -
reference_cds.faa
Reference genome CDS fasta file (Extract from genbank file) -
circos_config/
Circos config files directory -
circos_legend/
Circos legend files directory -
cogclassifier/
COGclassifier result files directory -
rbh_search/
MMseqs RBH result files directory
Example Gallery
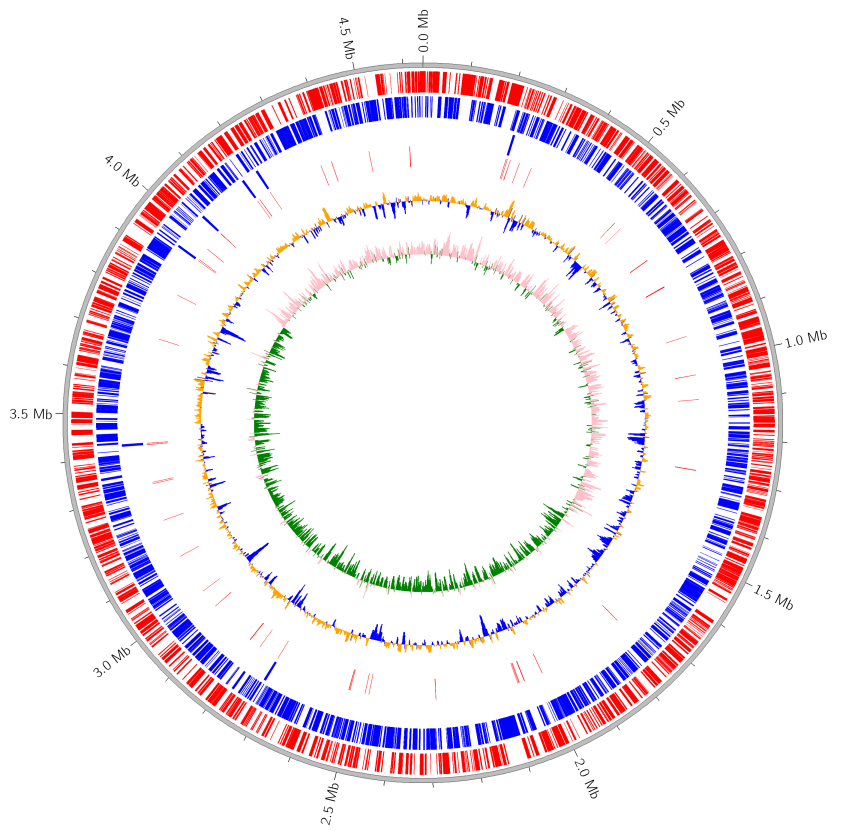
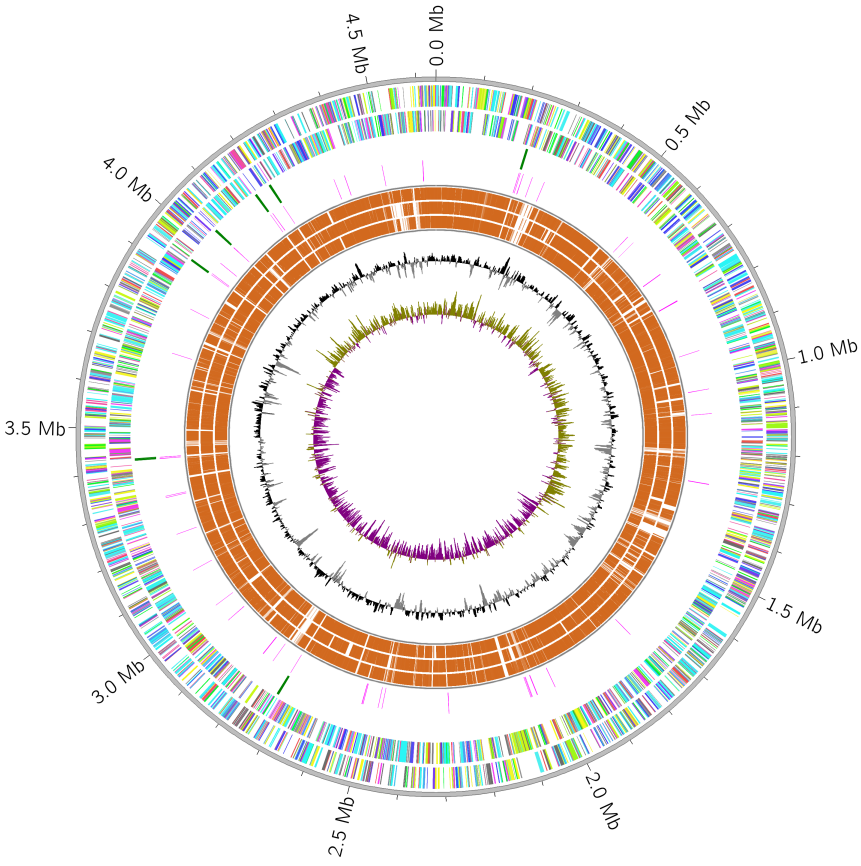
1. E.coli genome simple plot (No COG assignment)
Reference: ecoli.gbk (3.5 MB)
MGCplotter -r ./ecoli.gbk -o ./gallery_result01 --rrna_color blue --trna_color red \
           --gc_content_p_color orange --gc_content_n_color blue \
           --gc_skew_p_color pink --gc_skew_n_color green
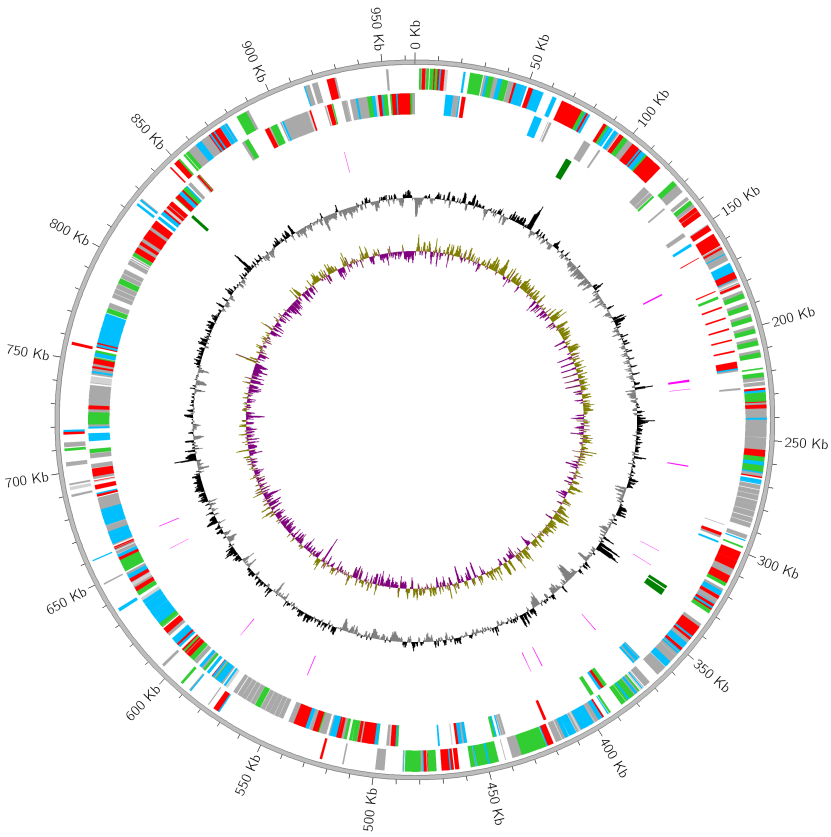
2. E.coli genome plot with 3 query conserved CDS
Reference: ecoli.gbk (3.5 MB), Query: gallery02 (10.7 MB)
MGCplotter -r ./ecoli.gbk -o ./gallery_result02 --assign_cog_color \
           --query_files ./gallery02/NC_011751.gbk ./gallery02/NC_017634.gbk ./gallery02/NC_018658.gbk \
           --ticks_labelsize 50
Conserved CDS tracks are lined up from outside to inside in
--query_filesargument order. In this case, NC_011751,NC_017634,NC_018658 are lined up from outside to inside.
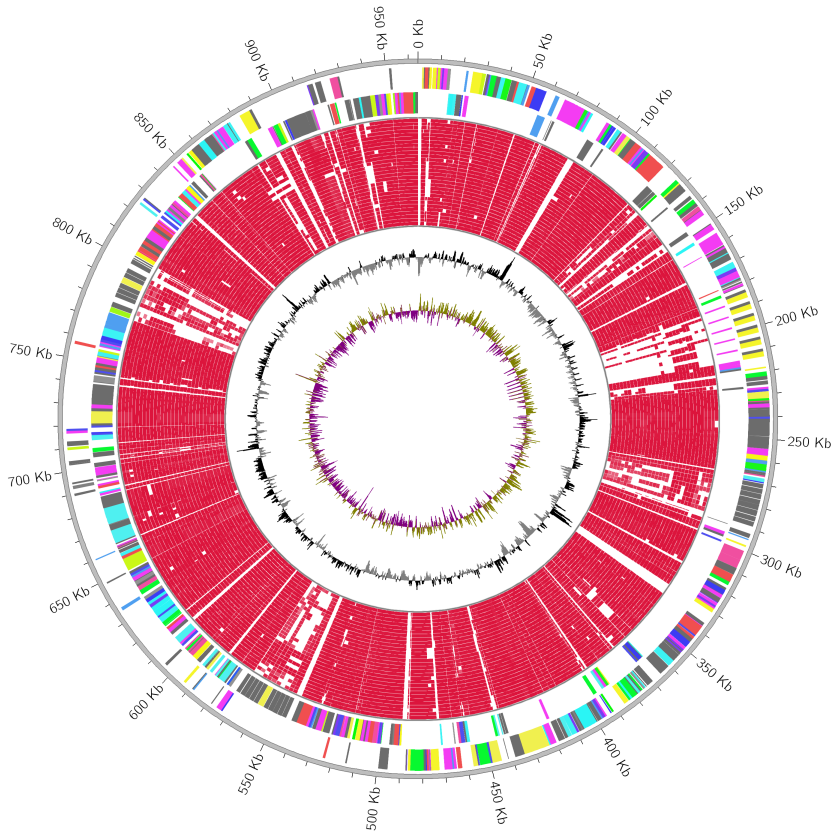
3. M.Gallisepticum genome plot with 30 query conserved CDS
Reference: Mgallisepticum.gbff (0.63 MB), Query: gallery03 (19.6 MB)
MGCplotter -r ./Mgallisepticum.gbff -o ./gallery_result03 --assign_cog_color \
          --query_files ./gallery03/*.gbff --conserved_cds_color '#dc143c' \
          --rrna_r 0 --trna_r 0 --conserved_cds_r 0.01
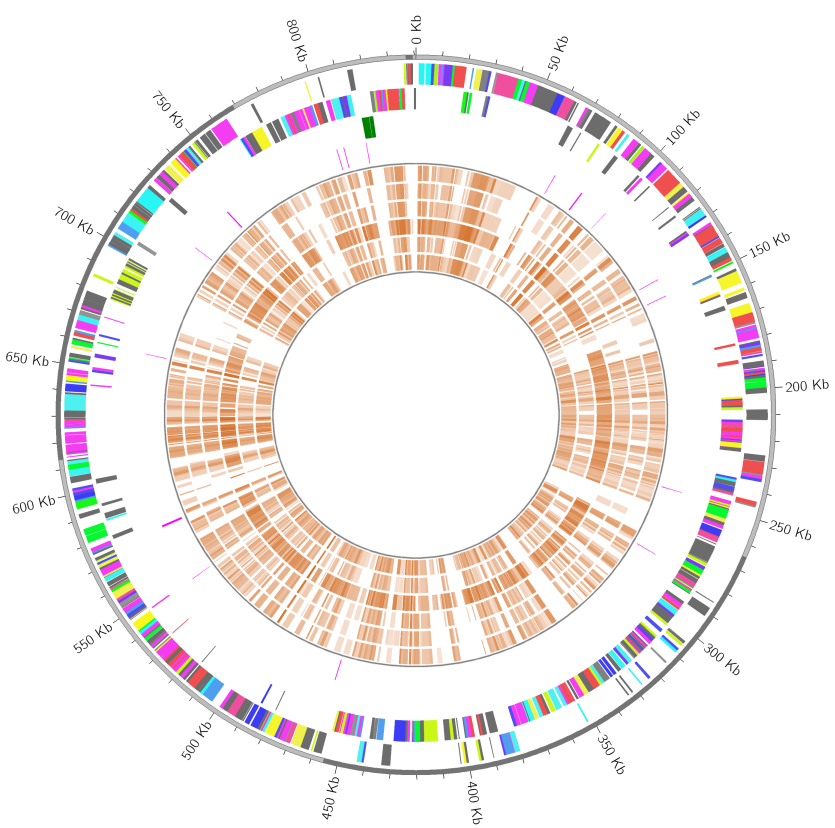
4. M.Alvi genome contigs plot with 6 query conserved CDS
Reference: Malvi.gbk (0.57 MB), Query: gallery04 (1.0 MB)
MGCplotter -r ./Malvi.gbk -o ./gallery_result04 --assign_cog_color \
           --query_files ./gallery04/*.faa --conserved_cds_r 0.05 \
           --gc_content_r 0 --gc_skew_r 0
Malvi.gbk is multi record(contig) Genbank format genome file. In MGCplotter, multi contigs are simply concatenated and each contig boundary is shown in mostouter circle color (lightgrey/darkgrey).
5. M.Gallisepticum genome plot (User-defined COG classification color)
Reference: Mgallisepticum.gbk (0.63 MB), COG Color Json: cog_color.json (0.5 KB)
MGCplotter -r ./Mgallisepticum.gbff -o ./gallery_result05 --assign_cog_color \
          --cog_color_json ./cog_color.json
User can change COG functional classification color by user-defined color json file. Template json file can be obtained by
generate_cog_color_templatecommand.
COG functional classification color template json
{
  "J": "#f43cf3",
  "A": "#f04ff0",
  "K": "#f04fa0",
  "L": "#f04f4f",
  "B": "#f4793c",
  "D": "#f0f04f",
  "Y": "#f3f43c",
  "V": "#f5f52a",
  "T": "#f7f718",
  "M": "#caf718",
  "N": "#9ef718",
  "Z": "#71f718",
  "W": "#45f718",
  "U": "#18f718",
  "O": "#07f830",
  "X": "#07f807",
  "C": "#2af5f5",
  "G": "#3cf3f4",
  "E": "#4ff0f0",
  "F": "#4f9ff0",
  "H": "#4f4ff0",
  "I": "#793cf4",
  "P": "#3c3cf4",
  "Q": "#2a5df5",
  "R": "#939393",
  "S": "#808080",
  "-": "#6c6c6c"
}
Release history Release notifications | RSS feed


Download files
Download the file for your platform. If you're not sure which to choose, learn more about installing packages.
Source Distribution
Built Distribution
Hashes for mgcplotter-1.0.1-py3-none-any.whl
| Algorithm | Hash digest | |
|---|---|---|
| SHA256 | eb53eac30fd135cbb30ccd6a255a98d413a960b2d3e98b4f05e0eab556d110cd |
|
| MD5 | 86f387947d4da0cb6a2399b69a7f6d64 |
|
| BLAKE2b-256 | 7671339a81fcc3b1020314ea209dffeec46744a8977743609b730db2ebf63f05 |


